Zoom Communications Earnings Release: Historical Trends and Insights
Zoom Communications (NASDAQ:ZM) plans to announce its earnings on Wednesday, May 21, 2025. Over the past five years, the stock has recorded negative one-day returns after earnings announcements in 68% of cases. The median return for these instances was -8.1%, with a maximum decline of -16.7%.
These historical trends can give event-driven traders essential insights. However, the actual market reaction will mainly rely on the reported results versus consensus estimates. Two strategies may help traders utilize this data effectively:
- Pre-earnings Strategy: Analyze historical reactions, then establish a position before the earnings release.
- Post-earnings Strategy: Investigate the immediate market response and correlate it with medium-term stock performance to inform trade decisions following the announcement.
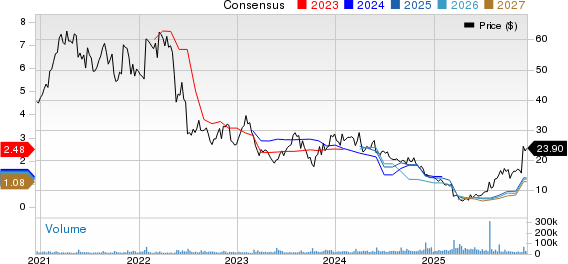
Currently, consensus estimates forecast Zoom will report earnings per share of $1.31 on revenues of $1.17 billion for the upcoming quarter. This is a decline from the same quarter last year, where the company reported earnings per share of $1.35 on revenues of $1.14 billion.
From a fundamental perspective, Zoom’s market capitalization stands at $26 billion. Over the last twelve months, the company generated $4.7 billion in revenue, achieving an operating profit of $813 million and a net income of $1.0 billion.
Examining Historical Post-Earnings Returns for Zoom Communications
Here are some observations concerning one-day (1D) post-earnings returns:
- Out of 19 recorded earnings data points in the last five years, there were 6 positive and 13 negative one-day returns, resulting in positive returns about 32% of the time.
- This percentage increases to 36% when considering only the last three years.
- The median for positive returns was 7.8%, while the median for negative returns was -8.1%.
The statistics for observed 5-Day (5D) and 21-Day (21D) returns post-earnings are detailed in the table below.
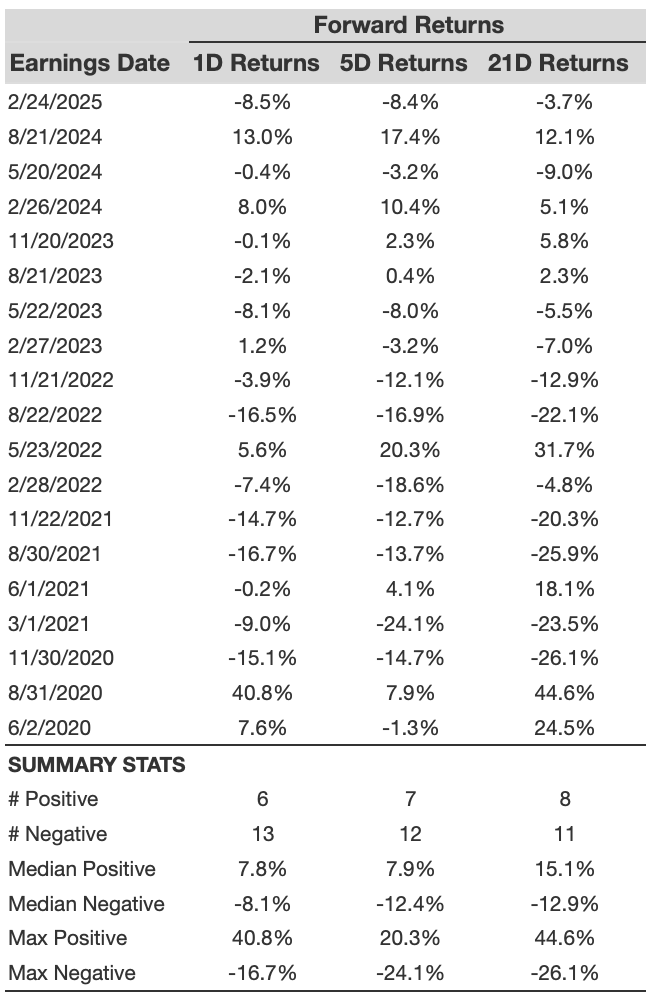
ZM 1D, 5D, and 21D Post earnings Return
Understanding Correlations Among Short-Term and Medium-Term Returns
A less risky approach involves understanding the correlation between short-term and medium-term returns following earnings. By identifying which returns are correlated, traders can make informed decisions. For instance, if 1D and 5D show a strong correlation, a trader may go “long” for the next five days following a positive 1D post-earnings return. Below is correlation data based on five-year and three-year histories.
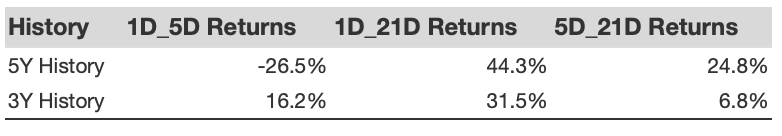
ZM Correlation Between 1D, 5D, and 21D Historical Returns
The Influence of Peer Earnings on Stock Performance
Occasionally, the performance of peers can impact post-earnings stock reactions. Market pricing may start shifting before the earnings are released. Historical comparisons reveal how Zoom’s post-earnings performance aligns with that of peers reporting around the same time.
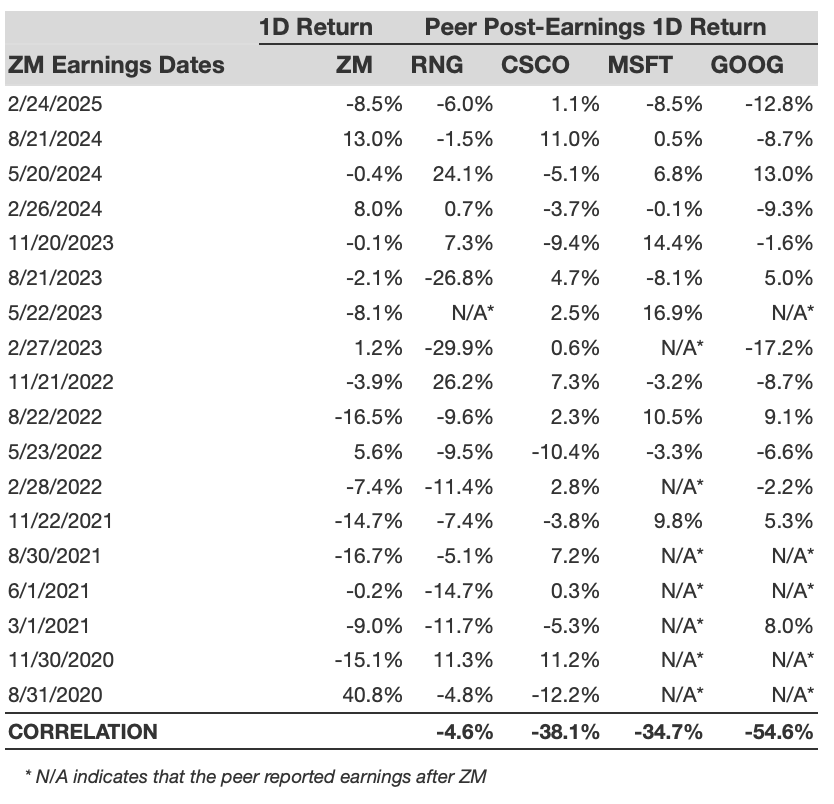
ZM Correlation With Peer earnings
The insights shared in this article provide a framework for analyzing Zoom Communications’ earnings performance. Investors should consider the historical data as they strategize their positions in this formidable tech stock.
The views and opinions expressed herein are the views and opinions of the author and do not necessarily reflect those of Nasdaq, Inc.