Trouble Lurks for Long-Term Treasury ETFs as Yields Rise
Long-term Treasury ETFs are facing challenges just as yield trends shift, pointing to a grim outlook.
After enjoying a period of falling interest rates, the market for U.S. Treasury bonds has turned. In October, yields saw a sharp increase, suggesting a troubling pattern known as the Death Cross.
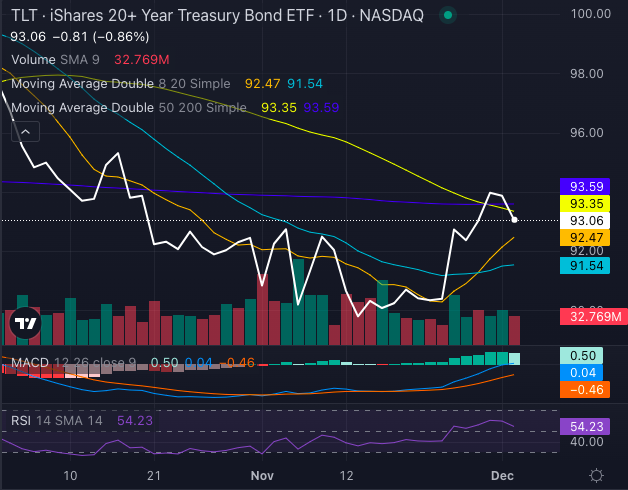
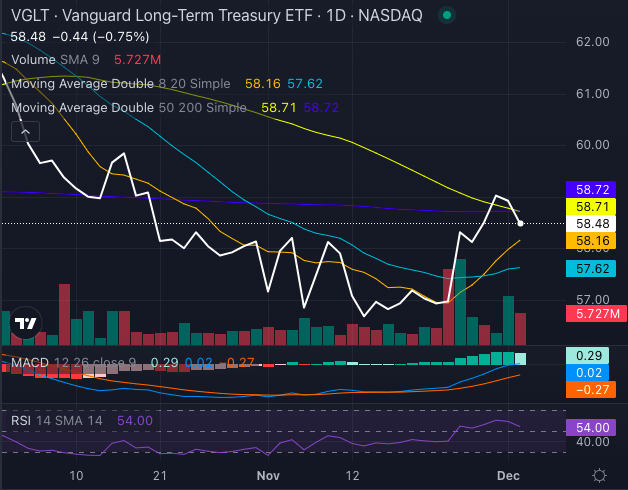
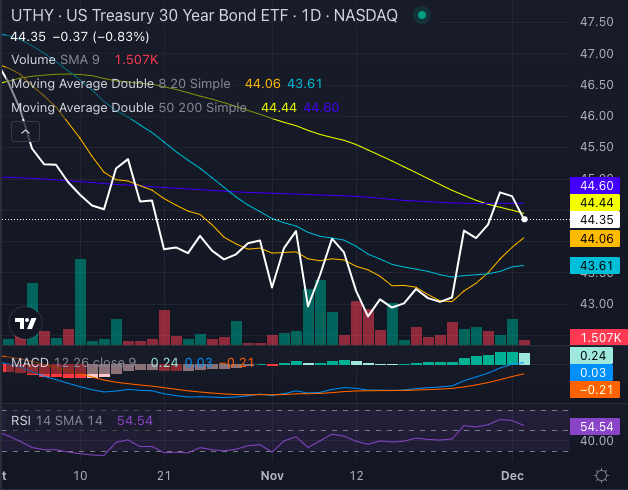
In the world of finance, the Death Cross is defined as the point when a short-term moving average (like the 50-day) dips below a long-term moving average (such as the 200-day).
This phenomenon is now affecting three major players in the bond market: the iShares 20+ Year Treasury Bond ETF TLT, the Vanguard Long-Term Treasury ETF VGLT, and the U.S. Treasury 30 Year Bond ETF UTHY.
After months of declining yields, long-end Treasury yields surged. The yield on the 10-year U.S. Treasury note, which hit a low of 3.63% in September, increased by more than 0.80% following anticipated cuts to the federal funds target rate in September and November.
Related Read: Viking Therapeutics Stock Faces Death Cross as Weight Loss Buzz Dwindles
This current trend has led to a decline in Treasury bond prices, resulting in losses for these ETFs.
Here’s a detailed look at the ETFs in question:
- iShares 20+ Year Treasury Bond ETF: Once a favored choice among investors, this ETF now shows its 50-day moving average has fallen below the 200-day. Although some buying interest is present, bearish indicators suggest a possible downturn. The current stock price is $93.06, with an RSI of 54.23, hinting at potential trouble for this long-duration bond fund.

Chart created using Benzinga Pro
- Vanguard Long-Term Treasury ETF: Similar to its counterpart, this ETF also sees its 50-day moving average below the 200-day. The chart mirrors that of the iShares fund and suggests potential for continued bearish movement as rate hikes loom. Its price stands at $58.48 with an RSI of 54, reinforcing the bearish outlook.

Chart created using Benzinga Pro
- U.S. Treasury 30 Year Bond ETF: This ETF is also facing pressure, with a current price of $44.35. While there are some positive indicators, the crucial moving averages suggest a challenging period is ahead.

Chart created using Benzinga Pro
The rise in long-term Treasury yields indicates that the favorable environment for long bonds might be over. Investors in these ETFs may need to reassess their positions amidst this higher interest rate landscape.
For holders of these ETFs, now might be the time to reconsider their investments as the potential for a Death Cross could lead to significant losses.
What’s Next:
Photo: Shutterstock
Market News and Data brought to you by Benzinga APIs


