Wall Street anticipates that Macy’s Inc M will report a loss of one cent per share and generate $4.72 billion in revenues in its third-quarter earnings report, set for release on Wednesday before market hours.
The retailer’s stock has declined 18.8% over the past year and is down 9.57% in the last six months.
Let’s explore the current performance of Macy’s stock and how it compares to Wall Street’s forecasts.
Also Read: Strategies to Earn $500 Monthly from Macy’s Stock Ahead of Q3 Earnings
Macy’s Stock Shows Positive Momentum Before Q3 Earnings
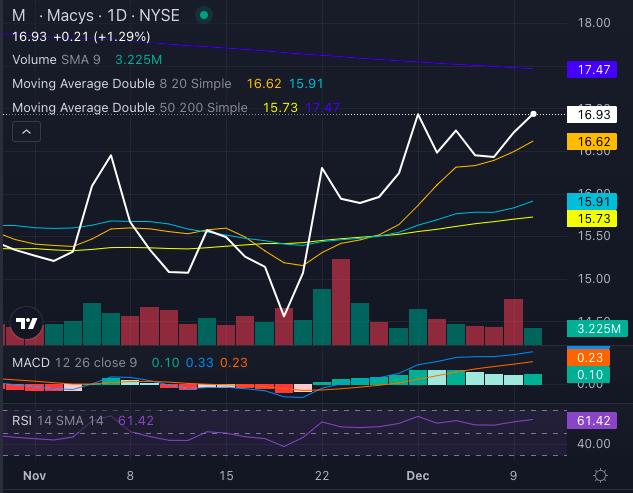
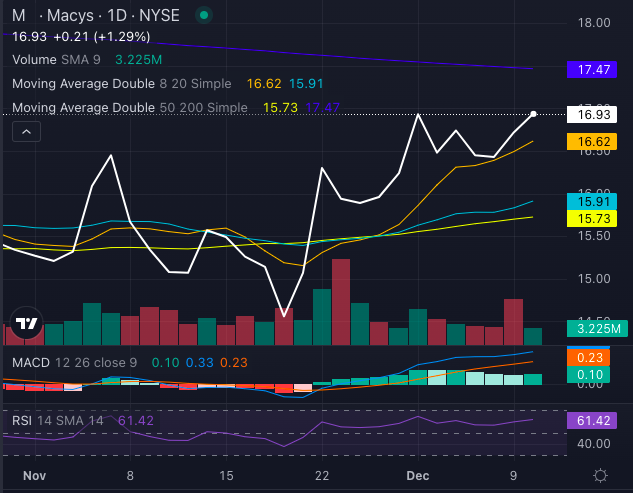
Macy’s stock is trending positively as it approaches its earnings announcement, trading above its five, 20, and 50-day exponential moving averages.

Chart created using Benzinga Pro
Currently priced at $16.93, Macy’s stock is above its eight-day simple moving average (SMA) of $16.62, 20-day SMA of $15.91, and 50-day SMA of $15.73, suggesting positive momentum. However, it remains below the 200-day SMA of $17.47, indicating possible resistance levels ahead.
The moving average convergence/divergence (MACD) reading of 0.33 adds to the optimistic outlook, while a relative strength index (RSI) of 59.38 indicates there’s still room for upward movement before the stock becomes overbought.
Despite this positive trend, there are signs of selling pressure, which might pose risks for potential downturns in the future.
Analysts Offer Cautious Outlook for Macy’s
Ratings & Consensus Estimates: Currently, analysts give Macy’s a consensus rating of Hold, with a price target averaging $19.93. Recent evaluations from Telsey Advisory Group and Morgan Stanley suggest a price target of $17, implying only a 1.07% potential increase.
Price Movement: Macy’s stock was priced at $16.89 at the time of this report.
Stay Informed:
Image: Shutterstock
Market News and Data brought to you by Benzinga APIs


