Q1 Earnings Season Insights: A Closer Look at the Magnificent 7
This week marks a pivotal moment in the Q1 earnings season, with over 800 companies preparing to release their results. Among these are four members of the “Magnificent 7” and 173 other S&P 500 constituents. Notable reports include Microsoft (MSFT) and Meta Platforms (META) slated for Wednesday, April 30th, followed by Apple (AAPL) and Amazon (AMZN) on Thursday, May 1st.
The Magnificent 7 stocks have played significant roles in the recent market rebound. However, their performance this year has been lackluster, especially during the recent sell-off that followed the market peak in February 2025.
Market Performance of Magnificent 7
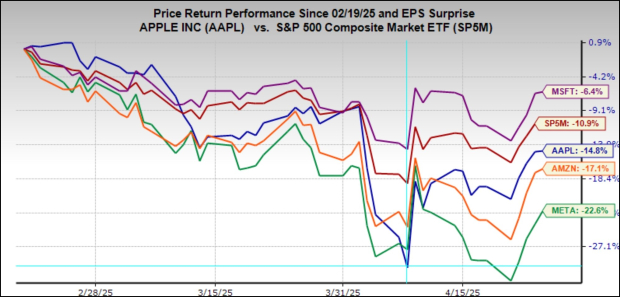
Among the four Magnificent 7 members reporting this week, Microsoft has shown resilience during the market’s downturn, outperforming the S&P 500 index. In contrast, Apple, Amazon, and Meta have experienced declines. From February 19, 2025, the performance metrics are as follows: Microsoft is down -6.4%, Apple -14.8%, Amazon -17.1%, and Meta has fallen by -22.6%. The S&P 500 itself is down -10.9% during this period.

Image Source: Zacks Investment Research
When examining performance from April 26, 2024, however, the landscape shifts. Meta and Apple emerged as the standout performers over the past year, while Amazon and Microsoft lagged behind.
Investment in AI Technologies
The Magnificent 7, including Alphabet (GOOGL) and Nvidia (NVDA), all lead in artificial intelligence advancements and are investing significantly in data center infrastructure. These investments aim to facilitate the operation of large language models critical for AI developments.
Despite ongoing skepticism about the economic returns from these substantial expenditures—especially post-DeepSeek announcement in January—companies like Alphabet are maintaining their capital expenditure plans. This sentiment is likely echoed by Microsoft, Meta, and Amazon in their upcoming reports. The market’s skepticism extends beyond the Magnificent 7, impacting all companies involved in AI, which were previously favored by investors.
Challenges Facing the Magnificent 7
The potential for trade tensions adds to the uncertainty faced by major players such as Apple, Tesla, Nvidia, and Amazon. If recession risks heighten due to tariff issues, all Magnificent 7 companies could be affected. Their sensitivity to economic fluctuations, particularly for Alphabet and Meta, is significant given their reliance on digital advertising. Additionally, Apple and Tesla offer discretionary products that may be delayed or cut during economic hardships.
Earnings Expectations for the Magnificent 7
The overall expectation for the Magnificent 7 is a 19.6% increase in Q1 earnings for 2025 compared to the same quarter last year, with a forecast of 10.9% higher revenues. These figures represent a combination of actual results from Alphabet and Tesla, alongside estimates for Microsoft, Apple, Amazon, and Meta.
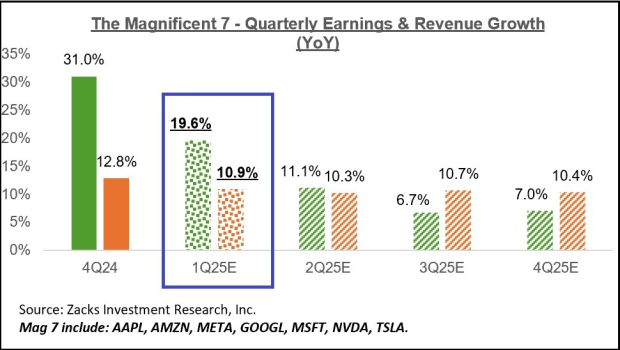
Image Source: Zacks Investment Research
The annual earnings and revenue growth expectations for the Magnificent 7 are also summarized in the following chart.
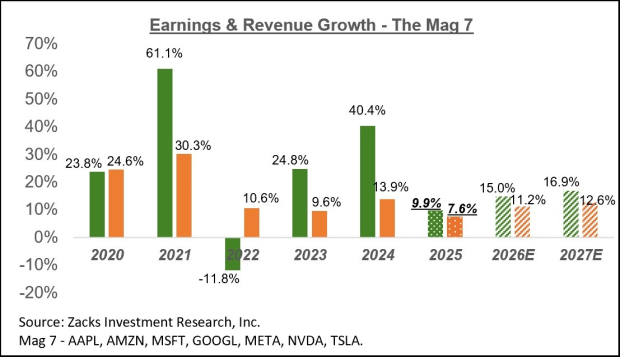
Image Source: Zacks Investment Research
Estimations for the Magnificent 7 have recently been under pressure, dropping from a projected +15.7% growth to +9.9% for this year.
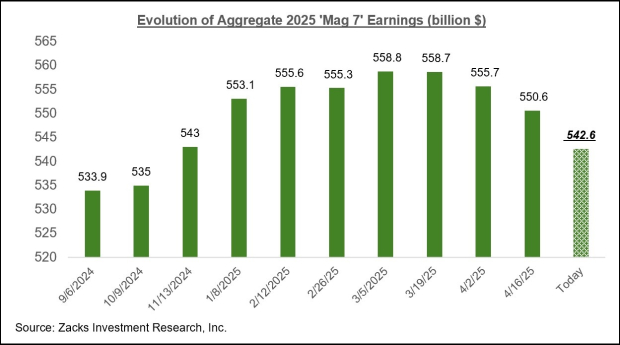
Image Source: Zacks Investment Research
Q1 Earnings Reports This Week
Beyond the four Magnificent 7 members, over 800 companies across various sectors will report Q1 results this week, including 177 S&P 500 constituents. Key players such as McDonald’s, Starbucks, UPS, Pfizer, Visa, Caterpillar, International Paper, Airbnb, Exxon, and Chevron are included. By week’s end, we will have seen results from 356 S&P 500 members, which accounts for 71.2% of the index.
Current Q1 Earnings Scorecard
As of April 25th, Q1 results from 179 S&P 500 members reflect an 18% increase in total earnings from the same period last year, supported by a 4.2% rise in revenue. Notably, 69.8% of these companies surpassed EPS estimates, while 63.7% beat revenue projections.
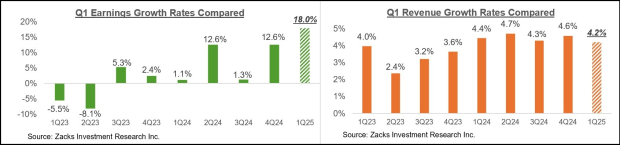
Image Source: Zacks Investment Research
Further comparison charts showcase Q1 EPS and revenue beats in historical context.
Q1 Earnings Show Decline in Expectations for S&P 500 Companies
Current earnings and revenue performance indicate that Q1 reporting is below historical averages. As of now, 69.8% of S&P 500 companies that have reported exceeded earnings per share (EPS) estimates, a decrease from the 79.1% average over the last 20 quarters. Revenue beat percentages are also trailing behind the historical average, although by a smaller margin.
Scrutiny of Q1 Estimates
When combining the actual results from 179 S&P 500 members and estimates for pending reports, the projected earnings growth is +9.4% year-over-year, alongside a +4% rise in revenues. This marks a significant drop from the previous period’s +14.1% earnings growth and +5.7% revenue gains.
The accompanying chart illustrates current expectations for earnings and revenue growth in Q1 2025, viewed alongside results from the previous quarter and forecasts for the next three quarters.
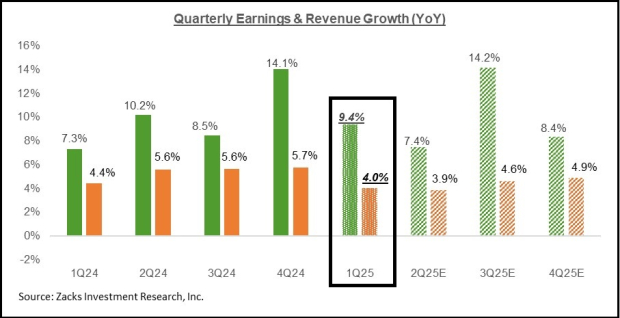
Image Source: Zacks Investment Research
In recent weeks, Q2 2025 estimates have been revised downwards. This trend of negative revisions is anticipated to continue as companies disclose their results and describe uncertainty in their short-term business outlooks.
Impact of Tariffs and Market Behavior
As the new tariff regime evolves, earnings estimates may need further reductions. The current market downturn reflects declining earnings expectations, as shown in the chart below, which charts the evolution of expectations since the beginning of the year.
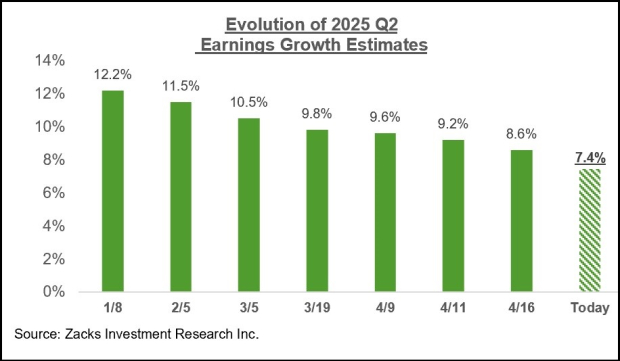
Image Source: Zacks Investment Research
Yearly Earnings Overview
Further analysis reveals a broader earnings landscape on a calendar-year basis. Recent estimates for the entire year of 2025 reflect a significant negative revision trend, a situation that has intensified since mid-February.
Estimates have been lowered for 14 out of the 16 Zacks sectors, with only Aerospace and Construction showing mild positive adjustments. The sectors experiencing the largest cuts include Transportation, Energy, Autos, Basic Materials, Technology, and Finance.
The chart below provides insights into how the overall earnings estimates for the Zacks Technology sector have changed over the past year.
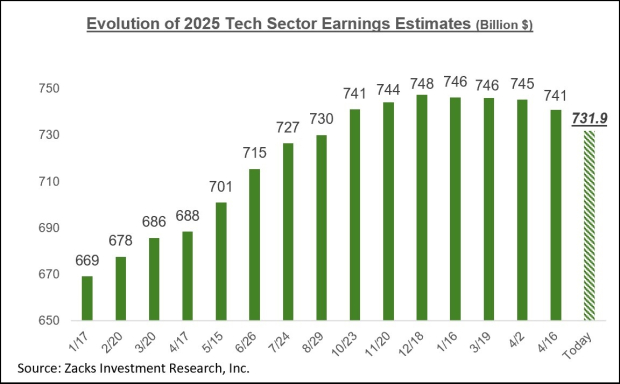
Image Source: Zacks Investment Research
Conclusion
The evolving earnings landscape continues to reflect broader market challenges. A clear understanding of these trends can inform investor strategies moving forward.
The views and opinions expressed herein are those of the author and do not necessarily reflect those of Nasdaq, Inc.