Big Tech Tariff Exemptions and Global Market Insights
Good (yet somewhat confusing) news!
Mixed Messages on Tariff Exemptions for Tech
Last Friday, the Trump administration announced exclusions for smartphones, computers, semiconductors, and other electronics from President Donald Trump’s “reciprocal” tariff list.
However, on Sunday, President Trump created confusion with a post on Truth Social, stating, “There was no Tariff ‘exception’ announced on Friday.”
Nonetheless, Yahoo! Finance reports:
The fact remains that Trump has offered at least a temporary boost to companies with strong ties to China, and investors are responding positively, sending stocks of impacted companies such as Apple and Dell (DELL) higher on Monday morning.
To clarify, these companies still face a 20% fentanyl-related tariff, plus any tariffs from both the Trump and Biden administrations. However, they appear to be avoiding the heavier 145% tariff currently in place.
This situation may not be stable…
Commerce Secretary Howard Lutnick indicated that many tech products will face new tariffs in a month or two. Trump reiterated that while tariffs on tech will still exist, they will simply be assigned to a different “bucket.”
We will see how this develops. For now, Wall Street reacted positively. As of Monday morning, all three major indexes are up, although they were higher earlier in the session. Given the current volatility in stocks, their future positions remain uncertain.
Before diving deeper…
Last Thursday’s Digest explored what may be Trump’s underlying motivation in this trade war: accelerating reshoring due to national security concerns. The U.S. has become dangerously reliant on other nations, particularly China.
With that context, here’s what Trump said on Friday:
We are taking a look at Semiconductors and the WHOLE ELECTRONICS SUPPLY CHAIN in the upcoming National Security Tariff Investigations.
What has been exposed is that we need to manufacture products in the United States, and that we will not be held hostage by other countries, especially hostile trading nations like China, which will do everything within its power to disrespect the American people.
We will keep you updated on this story, as it promises to significantly impact the market and your portfolio.
Why Foreign Stocks Deserve Your Attention
Let’s explore this further with insights from our macro investing expert, Eric Fry:
Many overseas stock markets are poised to outperform the U.S. market. This is driven not only by geopolitical factors but also by valuation discrepancies.
The current valuation of U.S. markets has reached unprecedented extremes compared to numerous foreign markets. Today, the U.S. market is more richly priced relative to many foreign markets than ever before.
For astute investors, this valuation gap signals a potential shift toward foreign stocks.
That said, the U.S. market will still harbor solid opportunities. However, it is likely that we will begin to notice more openings emerging in foreign markets.
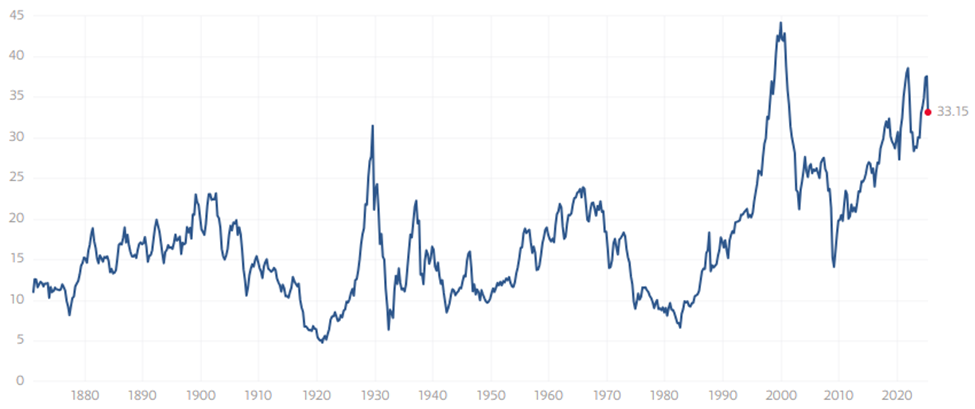
Historical data backs Eric’s assertions. For illustration, we can utilize the cyclically adjusted price-to-earnings ratio (CAPE).
This long-term market valuation tool factors in a rolling 10-year average of earnings to mitigate business cycle fluctuations.
While the CAPE ratio shouldn’t dictate market timing, it provides investors with a reliable expectation of long-term returns.
Market behavior tends to revert to the mean over time. Consequently, a stock or index currently boasting a high CAPE value is more likely to see a decline in value in the coming years.
As of now, even after the recent historic drawdown in the market, the U.S. CAPE ratio stands at 33.15. As illustrated below, this is among the highest figures recorded in over 150 years.

Source: Multpl.com
A high CAPE reading loses significance if foreign stock valuations are comparably high. However, that is not the case.
For comparison, we consulted with respected quant investor Meb Faber of Cambria Investments.
Earlier this month, Meb provided updated global CAPE ratios. With the U.S. CAPE ratio at 33.15 as a benchmark, here are the figures:
- Median CAPE Ratio: 16
- 25% cheapest: 11
- 25% most expensive: 25
- Average of Foreign Developed: 19
- Average of Foreign Emerging: 14
The U.S. market is therefore twice as expensive as the median reading and approximately 230% more costly than the average foreign emerging market.
Even when compared to the average of the 25% most expensive stocks, the U.S. remains about 33% pricier.
Aside from the CAPE, Meb shares three more valuation metrics: Cyclically Adjusted Price to Dividends, Cyclically Adjusted Price to Cash Flow, and Cyclically Adjusted Price to Book.
The outcome?
When combining all four valuation metrics, the U.S. ranks with India as the highest out of nearly 50 foreign markets Meb analyzes.
“Jeff, these cyclically adjusted valuation metrics are silly – the U.S. commands a higher valuation because, historically, it performs better and attracts more capital.”
This was previously my belief as well.
But…
Evaluating U.S. Market Valuations: Insights and Strategies for Investors
Meb’s 2016 study on market valuations has raised questions regarding the U.S. market’s long-term standing:
Many analysts cite various reasons supporting the U.S. stock market’s high valuation, including the rule of law, Generally Accepted Accounting Principles (GAAP) earnings, and stable governance. However, a historical review challenges these assertions…
If the U.S. is indeed “special,” it should consistently maintain that status. A sustained higher valuation would imply that historically, the U.S. market always enjoys a premium.
Yet, historical data tells a different story.
The chart below compares the U.S. CAPE ratio to that of world markets excluding the U.S., starting from 1980. Both groups show an average CAPE ratio around 22. It’s important to note: the historical valuation premium has been essentially zero.
Moreover, the duration each market spends at a premium compared to the other is nearly a coin flip.
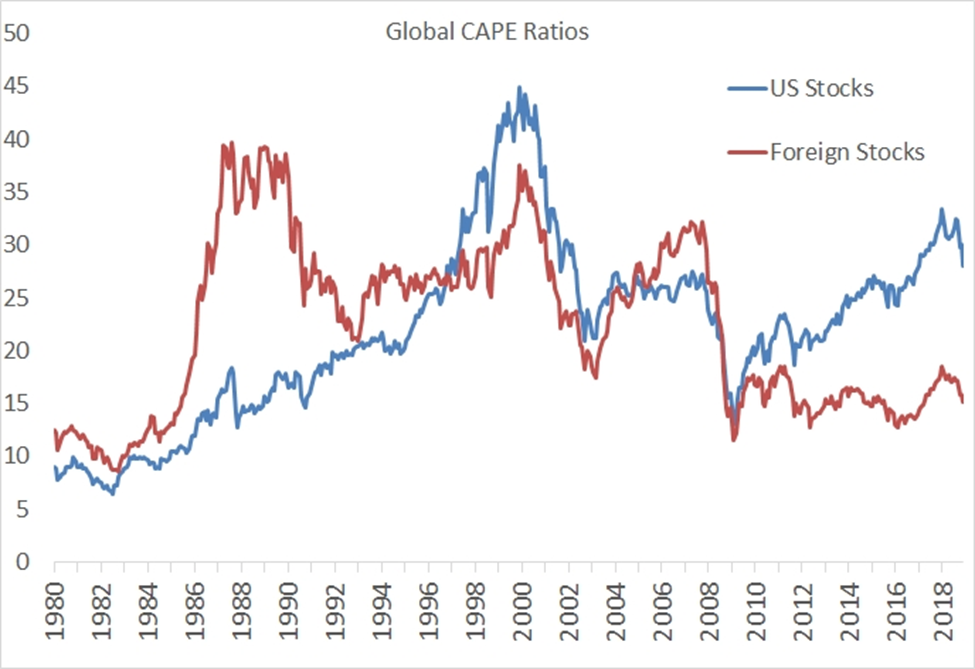
Source: Meb Faber / Global Financial Data
Looking at this year’s returns illustrates that the U.S. market is underperforming other global markets.
As highlighted below, the S&P 500 is down more than 7% year-to-date, whereas Japan (using EWJ, the iShares MSCI Japan ETF) remains flat. In comparison, Europe (through FEZ, the SPDR Euro Stoxx 50 ETF) has risen 12%, and China (via FXI, the iShares China Large-Cap ETF) is up 13%.
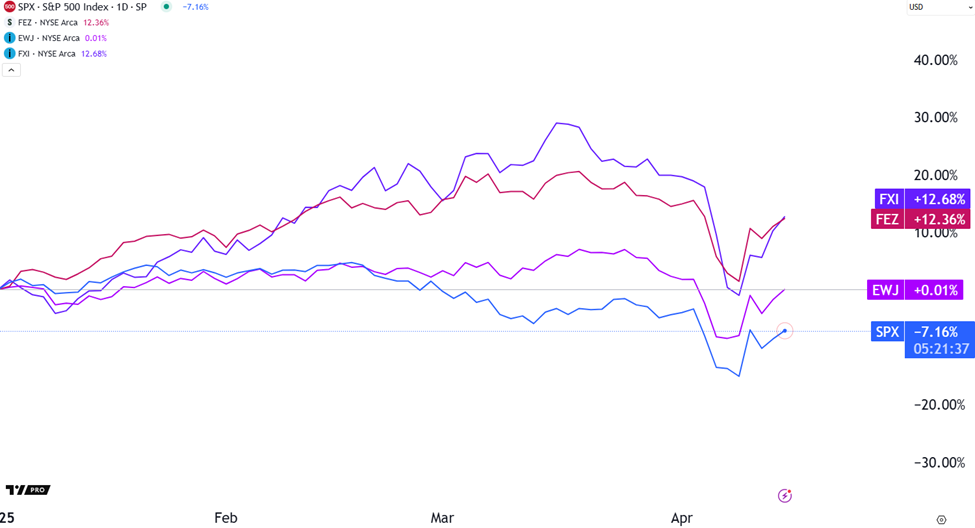
Source: TradingView
What Should Investors Consider for Their Portfolios?
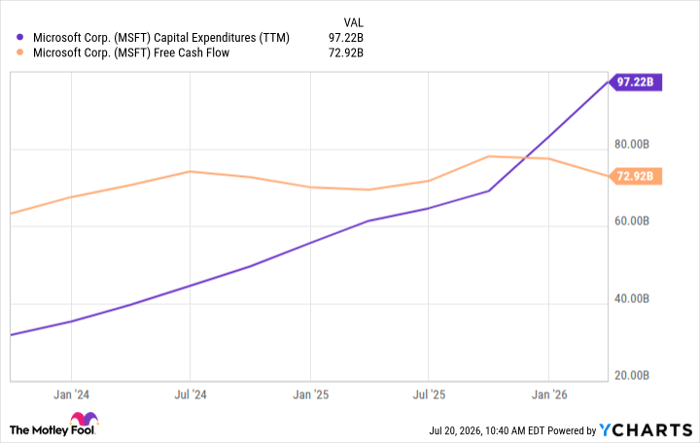
For those considering individual stocks, seek out foreign companies with limited exposure to trade conflicts or those possessing strong fundamentals to weather economic challenges.
Focus on companies that showcase robust cash flows and reasonable valuations.
This past Saturday, fellow Digest contributor Luis Hernandez spotlighted a strong pick: Canada Goose Holdings Inc. (GOOS), recognized as a global luxury performance and lifestyle brand.
Regarding the company’s exposure to trade issues, Eric mentions:
Canada Goose benefits from duty-free exports to the U.S. Thanks to the U.S.-Mexico-Canada Agreement (USMCA) signed by President Trump, there are no tariffs on apparel exports from Canada to the U.S.
Additionally, Canada Goose trades at a P/E ratio of 15.2, significantly lower than the S&P’s current P/E ratio of 26.7.
For those who prefer not to analyze individual foreign stocks, investing in entire markets through exchange-traded funds (ETFs) could be a viable option.
To gain exposure to European markets, for example, consider the FEZ ETF, which tracks the SPDR Euro STOXX 50.
Currently, Eric manages three “whole country ETFs” in his Investment report portfolio. Subscribers can access detailed insights by clicking here.
Opportunities in U.S. Stocks Still Exist for Savvy Investors
After discussing opportunities in foreign markets, Eric clarified, “This doesn’t preclude the existence of great opportunities within the U.S. market.”
So, how can investors locate these promising prospects?
One effective method is allowing data to guide your decisions.
While past performance does not guarantee future results, it can indicate which stocks possess a higher likelihood of future outperformance.
Turning to Keith Kaplan, CEO of our partner TradeSmith, a recognized leader in quantitative analysis, he advises:
Investing follows the principle that past performance provides predictive insights.
Your goal is to build a portfolio of strong performers—companies positioned for sustainable growth. Equally, it’s essential to identify and avoid underperformers that could negatively impact your portfolio.
This is the purpose of TradeSmith’s proprietary AI trading algorithm, named “An-E” (short for Analytical Engine), which is designed to assist in these decisions…
In just 21 trading days or fewer.
Latest Insights from An-E’s Predictions
In last Friday’s Digest, a case study highlighted one of An-E’s predictions and its subsequent performance.
Let’s examine another example.
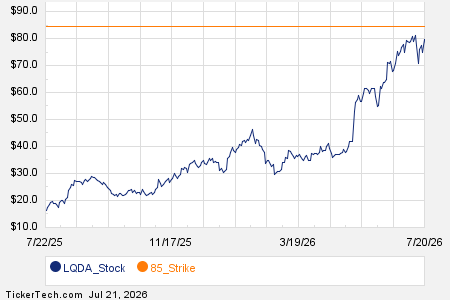
About a month ago, An-E flagged a trade opportunity on AAON Inc. (AAON), which has evidenced…
AI Confidence Level Reveals Market Insights for AAON Stock
Highlighting the effectiveness of AI in market forecasting, An-E presented a confidence gauge of 62% concerning its projections. This figure reflects An-E’s conviction level about its predictions.
To clarify, a 62% confidence level indicates neither superiority over 50% nor inferiority to 90%. A higher confidence level signifies that the algorithm predicts a greater likelihood of a Stock reaching its projected price.
Performance of AAON’s Stock Projection
So, how did this projection turn out?
While the confidence reading for AAON’s forecast wasn’t exceptionally high, it performed closely to expectations. By the target date of April 3, 2025, the HVAC equipment manufacturer’s Stock reached $79.16, falling just 58 cents short of its projection, which marked a gain of approximately 7%.
An-E’s Efficacy in Bearish Markets
In a recent analysis, Keith provided a real-time example of how An-E performs in bearish conditions. He concluded:
An-E doesn’t require stable markets to identify potential winners. Presently, An-E’s bearish forecasts demonstrate equal precision…
This approach helps not only in selecting stocks to buy but also in recognizing which ones to avoid and when to exit before market volatility increases.
Upcoming Event on AI Predictive Technology
This Wednesday at 8 p.m. ET, Keith will hold The AI Predictive Power Event. Participants will learn about the technology benefits and insights it offers during current market fluctuations, regardless of direction.
Notably, just for signing up, attendees will receive five of An-E’s most bearish forecasts—stocks that the AI platform anticipates will decline significantly in the upcoming weeks.
These forecasts are available for you to ensure you either trade accordingly or avoid these stocks entirely.
Here is Keith with a concluding thought:
Whether you’re focusing on offensive strategies to seize opportunities or defensive tactics to dodge pitfalls, An-E provides you with necessary clarity when it’s most crucial.
Click here to sign up for The AI Predictive Power Event and acquire An-E’s top bearish forecasts.
Wishing you a pleasant evening,
Jeff Remsburg
5 Stocks Our Experts Predict Could Double In the Next Year
By submitting your email, you'll also get a free pivot & flow membership. A free daily market overview. You can unsubscribe at any time.