
# Market Volatility Fuels Mixed Optimism Under Trump 2.0 Administration
### Recent Market Fluctuations Following Trump’s Election
Since Donald Trump’s election victory, market volatility has surged. Recent months have recorded:
– **Rapid Market Decline**: The S&P 500 fell over 12.1% in four sessions following the April 2 “Liberation Day” tariffs announcement.
– **Significant Two-Day Drop**: On April 3-4, the market faced a 10.5% decline, ranking as the fourth-worst two-day downturn since 1950.
– **Strong Single-Day Recovery**: A 9.5% rise occurred on April 9, following Trump’s 90-day pause on tariffs, marking the best single-day increase since October 2008.
– **Historic Winning Streak**: The S&P achieved a nine-day winning streak on May 2, a first in over 20 years, with a cumulative 10% gain.
– **High Volatility Index**: The CBOE Volatility Index (VIX) nearly doubled in six months, reaching 27.86, a key indicator of market anxiety.
Investors are questioning the stock market’s future under “Trump 2.0” and whether such volatility will remain constant.
### Strategic Outlook: Embrace the Boom, Beware the Bust
The U.S. market’s recent performance has been buoyed by an AI investment boom, propelling notable growth over the past two years. Major tech firms, including **Meta**, **Microsoft**, **Amazon**, and **Alphabet**, have invested heavily in AI, leading to substantial economic gains.
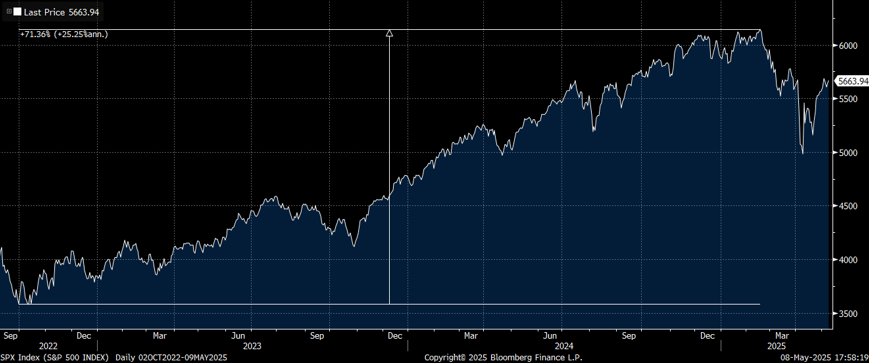
The S&P 500 increased more than 70% from its October 2022 lows to its peak in early February 2025. This represents a remarkable rally, with consecutive yearly gains exceeding 20% in 2023 and 2024—only the fourth instance of such back-to-back performance since the Great Depression.
### Potential for Continued Growth
Despite the rocky start to Trump’s second term, the stock market could be primed for renewed growth. Several factors indicate this:
– The AI investment trend remains robust.
– U.S. inflation has decreased to 2.4% year-over-year as of March 2025, down from 2.8%.
– The unemployment rate holds steady at 4.2%, consistent since May 2024.
– Consumer spending persists, though at a more cautious pace.
– Recent U.S.-U.K. trade agreements have eased tariff tensions.
– Rate cuts are anticipated, with analysts from JPMorgan Chase and Goldman Sachs predicting reductions later in 2025.
These elements suggest that although challenges persist, the stock market could experience another upswing as 2025 progresses.# Market Booms: Caution Amidst Anticipated Growth and Historical Risks
## Tax Cuts and Economic Projections
Tax cuts and regulatory reductions are on the horizon. The proposed extension of the 2017 Tax Cuts and Jobs Act could decrease federal tax revenue by $4.5 trillion from 2025 to 2034, potentially boosting long-run GDP by 1.1%.
## Stock Market Trends
Stocks have gained over 20% for two consecutive years, a rare occurrence last seen in 1935/36, 1954/55, and 1995/96. However, historical patterns show that these booms often lead to significant downturns shortly after.
## Historical Insights on Market Booms and Busts
In the 1935/36 boom, stocks dropped nearly 40% by 1937. After the gains of 1954/55, there was a 15% decline in 1957. Following the 1995/96 boom, a 50% crash occurred from 2000 through 2002. These events highlight a consistent pattern: market booms inevitably lead to busts, though timing remains uncertain.
## Strategies for Investors
As the current market shows signs of growth, caution is warranted. Investors should not retreat from stocks entirely but recognize the importance of timing. Historical data suggests that the final years of a boom often yield substantial profits, echoing the final year of the Dot Com Boom in 1999.
## Conclusion
To capitalize on the current market, investors should embrace the boom while remaining aware of potential busts. Monitoring warning signs becomes essential for successful navigation. Consider leveraging tools like Auspex, which identifies stocks likely to perform well in the near term, ensuring a proactive approach to investing.
Questions or comments can be directed to [email protected].


