Mastering Market Extremes for Wealth Building in Finance
If you’re eager to build wealth in the Stock, bond, and commodity markets, it’s essential to become a “connoisseur of extremes.” This mindset could set you apart from other investors, helping you recognize opportunities that others may overlook. Understanding this concept can significantly affect your financial success.
Understanding Market States
Financial markets typically operate in stable, uneventful conditions that seldom attract dramatic headlines. You’re familiar with them: “Dow Has Worst Week Since Great Depression” or “Investors Lose Billions in Friday Market Crash.” Yet, the market is inherently dynamic, influenced by factors such as booms, busts, political upheavals, interest rate changes, and more. These shifts can create scenarios where prices deviate significantly from what is considered normal.
By searching for these extreme states, you can identify when market conditions are significantly skewed. Capitalizing on these movements allows you to make low-risk profits across various asset classes.
Types of Extremes in Financial Markets
Extremes can arise in multiple asset categories, including stocks, commodities, real estate, bonds, and currencies. They may be fundamental, relating to valuation, or they may pertain to price action as interpreted through technical analysis.
Fundamental Extremes
To illustrate a fundamental valuation extreme, consider U.S. stocks in 1982. During this time, the price-to-earnings (P/E) ratio dropped to around 8, well below the historical average of 16, indicating that stocks were undervalued. As investor sentiment plummeted, this presented an ideal buying opportunity. The market surged by 50% within a year and eventually experienced a tenfold increase over the next 17 years.
Conversely, in 1999, the market showcased excessive optimism, with a P/E ratio soaring to 33. This overvaluation signified a poor time to invest, as the market subsequently faced a prolonged decline. Therefore, understanding historical valuations can guide whether to buy or avoid an asset.
Technical Extremes
Technical analysis involves examining price movements and trading volume to inform investment decisions. Contrary to popular belief, it is not about predicting the market; it’s aimed at interpreting data to assess market conditions effectively. Techniques like the Relative Strength Index (RSI) can help measure when a stock is oversold or overbought. By identifying these conditions, you can anticipate reversals in market trends.
For instance, I frequently trade blue-chip stocks, such as Coca-Cola and McDonald’s. These businesses have established reputations and typically maintain shareholder-friendly policies. However, they can face adversity. A disappointing earnings report might depress their stock prices to “oversold” levels, creating a buying opportunity as these resilient companies tend to recover from temporary setbacks.
Sentiment Extremes
Market sentiment reflects collective investor optimism or pessimism regarding an asset. Gauging this sentiment can be complex and often resembles an art more than a science. Nevertheless, the objective remains consistent: identify extreme levels of market emotion. Detect situations where prevailing sentiments shift profoundly—either into excessive optimism or stark pessimism.
Understanding these extremes—whether they are fundamental, technical, or sentiment-driven—equips you to navigate investments strategically. By recognizing when asset valuations stray from their historical norms, you can enhance your investment decisions and foster wealth in your financial journey.
# Understanding Market Sentiment: A Contrarian Investment Approach
In investing, a successful strategy can often involve doing the opposite of what the majority believes. If most investors are bullish about a specific asset, consider betting against it. Conversely, if they are bearish, the asset might be undervalued and due for a rebound.
## Gauging Market Sentiment
Investor sentiment can be loosely tracked through various informal indicators. For instance, magazine covers are a strong gauge of public interest. When a mainstream publication like Newsweek or Time features an asset with a glowing headline, this often signals that it is overhyped and overpriced. Historically, during market peaks such as the dot-com bubble of the late 1990s, stocks dominated magazine covers, a clear warning sign for astute investors. Likewise, in 2006, the media’s fascination with the real estate boom raised red flags.
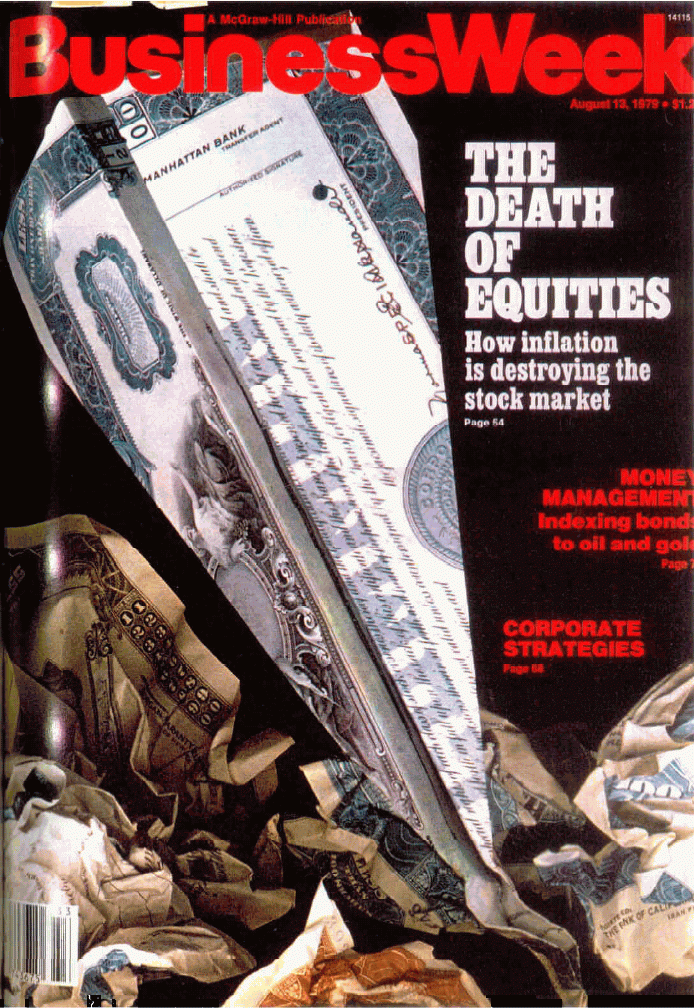
Conversely, the public narrative can shift dramatically during market downturns. A notable example occurred in 1979 when BusinessWeek published a cover story titled “The Death of Equities” just before a significant market upswing began.
## The Role of Social Sentiment
Equally telling is the chatter at social gatherings. Engaging in conversations at cocktail parties or family events can provide insight into public sentiment about specific investments. When enthusiasm for an asset peaks—like when Bitcoin surged in late 2017—it often signals danger. If everyone is buying in, the remaining potential for new investors diminishes, indicating a possible downward trend.
In stark contrast, when an asset draws little interest, it may represent a strong buying opportunity.
A personal example from 2003 illustrates this. At that time, I invested significantly in gold, a move met with skepticism. Many considered owning gold eccentric, but it eventually saw significant appreciation from those levels.
## The Principle of Reversion to the Mean
This contrarian strategy leverages a market force known as “reversion to the mean.” This principle describes the tendency for assets in abnormal conditions to return to more typical valuations.
We see “reversion to the mean” in various contexts. For example, achieving an NFL Super Bowl requires an extraordinary alignment of circumstances—talented players, effective coaching, and an overall stellar performance. Due to this rarity, back-to-back championships are uncommon, as teams tend to revert to more average outcomes in subsequent seasons.
Similarly, consider highly traded blue-chip stocks. If a stock like Coca-Cola faces heavy selling pressure over time, its sharp decline often sets the stage for a recovery as it reverts to its average trading behavior.
## Understanding Valuation and Market Sentiment
Valuation extremes frequently coincide with technical and sentiment fluctuations. Relying solely on either fundamental or technical analysis can limit investment strategies. For example, post-2010’s Gulf of Mexico oil disaster, investors irrationally sold offshore drilling stocks, causing significant price declines even among firms with limited exposure. This general panic led to undervalued stocks at five times earnings, presenting a buying opportunity.
When I saw the offshore drilling sector in an “extremely oversold” state, I took a long position with options. This led to substantial returns as stocks rallied sharply, further demonstrating the interplay of valuation, sentiment, and technical analysis.
## Bridging Fundamental and Technical Analysis
Investors frequently face the question: “Are you a fundamentalist or a technician?” This ongoing debate often results in dismissive attitudes toward the opposing view. However, I contend that both forms of analysis are interconnected and inseparable. This relationship resembles the concept of yin and yang from Eastern philosophy.
In my view, fundamentals drive technical performance and sentiment, creating a feedback loop that influences investors’ perceptions. This concept ties to George Soros’ theory of reflexivity, emphasizing that market conditions and investor sentiment influence each other in a continuous cycle.
Thus, when asked whether I focus on fundamentals or technicals in trading, I simply respond: “Both. After all, they are the same thing.”
Whichever approach you adopt, aim to cultivate the skill of becoming a “connoisseur of extremes.”
Next, let’s explore a vital question that many investors overlook: “How many days rich are you?”
Regards,
Brian