Unlocking Income Potential: A Closer Look at NOV Inc’s Covered Call Strategy
How Trading Options Can Enhance Your Dividend Returns
Shareholders of NOV Inc (Symbol: NOV) seeking to amplify their income beyond the stock’s 2% annualized dividend yield have an option to sell the August covered call at the $17 strike price. By doing so, investors can secure a premium based on the 90 cents bid price. This strategy results in an additional annualized return of 9.8% based on the current stock price, leading to a potential total annualized return of 11.8% if the stock is not called away. Should the stock price exceed $17, these shareholders would forfeit any upside beyond that level. However, a price increase of 13.6% would trigger calling the stock, yielding a total return—including dividends—of 19.7% from this trading strategy, assuming the stock was sold at that level.
Dividend payouts can fluctuate and are often tied to a company’s profitability. For NOV Inc, examining the historical dividend chart below can help assess whether the latest dividend is likely to be sustainable and whether a 2% annualized dividend yield is a reasonable expectation.

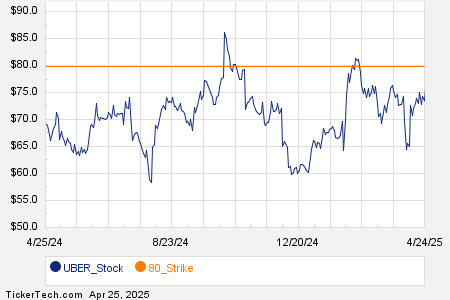
The following chart showcases NOV’s trailing twelve-month trading history with the $17 strike price indicated in red:

The stock’s historical volatility, paired with fundamental analysis, serves as a valuable guide for evaluating whether selling the August covered call at the $17 strike offers an adequate reward for the associated risks of capping profit potential above this price. NOV Inc’s trailing twelve-month volatility has been calculated at 32%, based on the last 251 trading day closing values alongside the current price of $14.89. For other call option strategies with varying expiration dates, please visit the NOV Stock Options page on StockOptionsChannel.com.
During mid-afternoon trading on Thursday, the S&P 500 saw a put volume of 1.03M contracts compared to a call volume of 1.91M, resulting in a put:call ratio of 0.54 for the day. This figure indicates a significantly higher call volume than the long-term median put:call ratio of 0.65, suggesting a strong preference for call options among traders at this time.
![]()
![]() Explore Today’s Most Talked About Call and Put Options »
Explore Today’s Most Talked About Call and Put Options »
Additional Insights:
- Stocks Being Bought By Hedge Funds
- GPS Split History
- Top Ten Hedge Funds Holding CLNC
The views and opinions expressed herein are the views and opinions of the author and do not necessarily reflect those of Nasdaq, Inc.