Maximizing Income: Strategies for Tecnoglass Inc. (TGLS) Shareholders
Exploring Covered Call Options for Increased Returns
Shareholders of Tecnoglass Inc (Symbol: TGLS) have the opportunity to enhance their earnings beyond the stock’s current 0.8% annualized dividend yield. By selling the October covered call at the $90 strike, investors can collect a premium based on the $8.60 bid. This approach could potentially yield an annualized return of 13.7% on the current stock price, resulting in a total return of 14.5% if the stock is not called away. However, should the stock surpass $90, the upside would be forfeited. Presently, TGLS shares would need to rise 13.4% for that scenario to unfold. In this case, a shareholder could still achieve a total return of 24.3% from this trading strategy, along with any dividends earned prior to the stock’s sale.
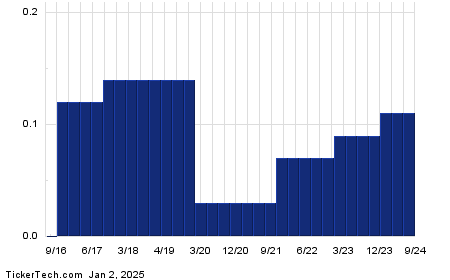
Generally, dividend distributions can be unpredictable as they often fluctuate with a company’s profitability. For Tecnoglass Inc, analyzing the dividend history chart for TGLS shown below can provide insights into whether the recent dividend is expected to continue, thus helping to inform investors about the reasonable expectation of the 0.8% annualized yield.

Historical Performance and Volatility Insight
The chart below illustrates TGLS’s trailing twelve-month trading activity, with the $90 strike clearly marked in red:

This chart, in conjunction with the stock’s historical volatility, serves as a useful tool for assessing whether selling the October covered call at the $90 strike is an advantageous decision. To make informed choices, it’s important to consider that most options are likely to expire worthless. For Tecnoglass Inc, we calculated a trailing twelve-month volatility of 45%, taking into account the last 251 trading day closing values and today’s price of $79.03. For additional options strategies across different expiration dates, visit the TGLS Stock Options page on StockOptionsChannel.com.
Market Activity: Call vs. Put Options
During mid-afternoon trading on Thursday, S&P 500 components reported a put volume of 1.03 million contracts against call volume of 1.91 million contracts, resulting in a put:call ratio of 0.54 for the day. This indicates a notable preference for call options compared to puts, as the long-term median put:call ratio stands at 0.65. In essence, today’s trading reflects a strong inclination among buyers towards call options in the market.
Discover which 15 call and put options are currently generating discussion among traders.
![]() Top YieldBoost Calls of the S&P 500 »
Top YieldBoost Calls of the S&P 500 »
Also see:
- NBL Videos
- CM YTD Return
- Top Ten Hedge Funds Holding SYM
The views and opinions expressed herein are those of the author and do not necessarily reflect those of Nasdaq, Inc.


