Microsoft Shares Slide Below Key Moving Average
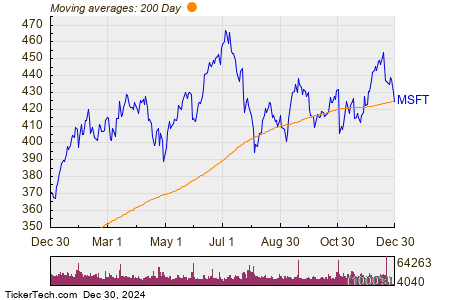
On Monday, Microsoft Corporation (Symbol: MSFT) experienced a notable decline in its stock price, dropping below its 200-day moving average of $425.14. During trading, shares fell as low as $421.90, reflecting a decrease of approximately 1.1% for the day.
The chart below illustrates the performance of MSFT shares over the past year compared to the 200-day moving average:

Examining the chart, we can see that Microsoft has a 52-week low of $366.50 and a high of $468.35. The latest trade showing MSFT at $424.95 provides insight into its current market position. This moving average data was sourced from TechnicalAnalysisChannel.com.
![]() Discover which 9 other dividend stocks have recently fallen below their 200-day moving average »
Discover which 9 other dividend stocks have recently fallen below their 200-day moving average »
Also see:
- Moodys YTD Return
- RDFN Insider Buying
- VFC YTD Return
The views and opinions expressed herein are those of the author and may not reflect the views of Nasdaq, Inc.


