Surge in Options Trading: Highlights from CrowdStrike, Amazon, and Eli Lilly
High Volume for CrowdStrike Holdings
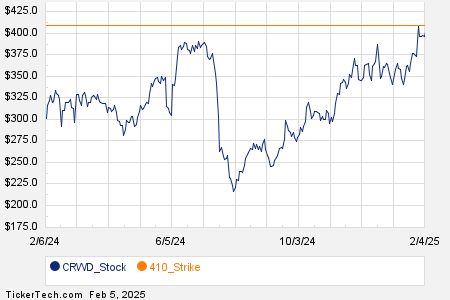
Today, options trading for CrowdStrike Holdings Inc (Symbol: CRWD) has seen significant activity. A total of 37,594 contracts have been traded, which equates to approximately 3.8 million underlying shares. This trading volume represents 112.8% of CRWD’s average daily trading volume of 3.3 million shares over the past month. Notably, the $410 strike call option expiring on February 07, 2025, has attracted attention, with 2,520 contracts changing hands, representing about 252,000 underlying shares of CRWD.
Below is a chart showing CRWD’s trailing twelve-month trading history, highlighting the $410 strike in orange:

Amazon Sees Heavy Options Activity
Amazon.com Inc (Symbol: AMZN) options are also witnessing busy trading, with 291,302 contracts traded today, translating to approximately 29.1 million underlying shares. This figure represents 88.5% of AMZN’s average daily trading volume of 32.9 million shares for the last month. The $235 strike call option expiring on April 17, 2025, recorded especially high trading, with 15,059 contracts traded, equating to around 1.5 million underlying shares of AMZN.
Here’s a look at AMZN’s trailing twelve-month trading history, with the $235 strike marked in orange:

Eli Lilly’s Options Trading Trend
Eli Lilly (Symbol: LLY) reported a trading volume of 32,713 options contracts, corresponding to about 3.3 million underlying shares, or 81.3% of LLY’s average daily trading volume of 4.0 million shares. The $750 strike put option with an expiration date of July 18, 2025, exhibited particularly strong demand, with 1,153 contracts traded, representing approximately 115,300 underlying shares of LLY.
Below is a chart depicting LLY’s trailing twelve-month trading history, with the $750 strike highlighted in orange:

For additional insights and options expirations for CRWD, AMZN, or LLY, you can visit StockOptionsChannel.com.
![]()
![]() Today’s Most Active Call & Put Options of the S&P 500 »
Today’s Most Active Call & Put Options of the S&P 500 »
Also see:
- Howard Marks Stock Picks
- CDE Split History
- HTCR Historical Stock Prices
The views and opinions expressed herein are the views and opinions of the author and do not necessarily reflect those of Nasdaq, Inc.