Marcus & Millichap Shares Slip Below Key Moving Average
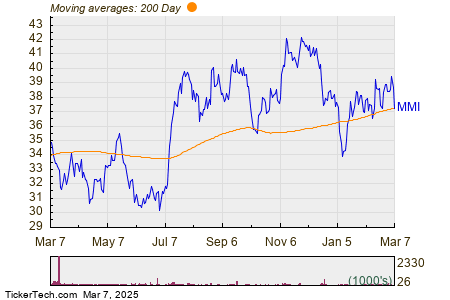
In trading on Friday, shares of Marcus & Millichap Inc (Symbol: MMI) fell below their 200-day moving average of $37.28, reaching a low of $37.02 per share. As of the latest update, Marcus & Millichap Inc shares are down about 3.7% for the day. The accompanying chart illustrates the one-year performance of MMI shares in comparison to its 200-day moving average:

Analyzing the chart, MMI has a 52-week low of $29.93 per share and a high of $42.804. Currently, the stock is trading at $37.27.
 Click here to discover which 9 other stocks have also crossed below their 200-day moving average.
Also see:
- REITs Dividend Stocks
- Top Ten Hedge Funds Holding CCON
- Funds Holding SQBG
The views and opinions expressed herein are the views and opinions of the author and do not necessarily reflect those of Nasdaq, Inc.
5 Stocks Our Experts Predict Could Double In the Next Year
By submitting your email, you'll also get a free pivot & flow membership. A free daily market overview. You can unsubscribe at any time.