Eager to stay ahead of the pack for the week? Dive into Momentum Mondays for a roundup of potential breakout stocks, a summary of upcoming major events, and valuable insights for investors aiming for profitable trading.
Today, let’s examine the recent movement in broad stock market indexes, analyze the economic calendar and earnings announcements to anticipate market-moving data, and reveal four compelling technical trade setups in high-Zacks Rank stocks.
Impending Economic and Earnings Events
This week, investors brace for significant market activity with crucial economic data releases and quarterly earnings reports.
The presence of Fed speakers throughout the week, coupled with evolving interest rate expectations, may introduce volatility to the market. Additionally, the upcoming CPI and Core CPI inflation data on Wednesday, followed by Thursday’s initial jobless claims and Friday’s PPI and Core PPI, will be pivotal for both policymakers and investors.
Earnings reports are aplenty this week, featuring calls from industry giants such as Artista Networks, Coca-Cola, Shopify, Occidental Petroleum, Applied Materials, and many others.
Equity Surges Fueled by Semiconductors
Equity indexes maintain a relentless upward trajectory, driven by remarkable advancements in Semiconductor stocks. The phenomenal performances of Nvidia, Super Micro Computer, and ARM Holdings within the first six weeks of the year exemplify this incredible surge.
It appears that the market is still in the initial phase of assimilating the Artificial Intelligence surge.
The Nasdaq 100 QQQ recently broke higher from a bull flag, signaling the potential for a substantial upward trade toward the upper bound. This channel serves as a barometer for market sentiment.
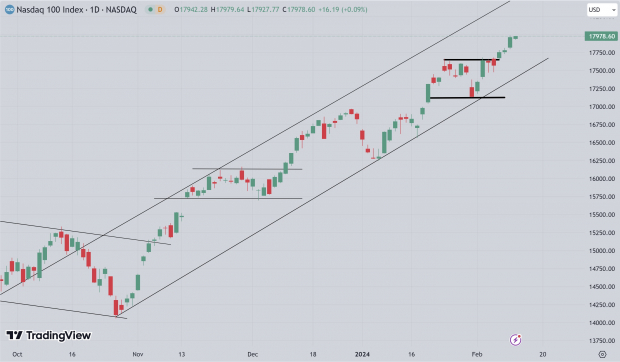
Image Source: TradingView
Strategic Trade Setups
This week centers around earnings gaps and bull flags. Every stock shared today has witnessed substantial upward gaps following earnings, followed by lateral movement. This establishes a fantastic setup for high probability trading. Furthermore, the high Zacks Rank (#1 – Strong Buy) of these stocks enhances the likelihood of a winning trade.
Today, I present two defensive stocks and two aggressive stocks. In the event of a market downturn, the defensive names are poised to outperform, while in a continued market rally, the aggressive stocks are likely to excel.
Below, we observe the chart for Clorox CLX. A move above the $154.20 level would signify a breakout. Conversely, an inability to sustain the $152.60 support level would invalidate the setup.
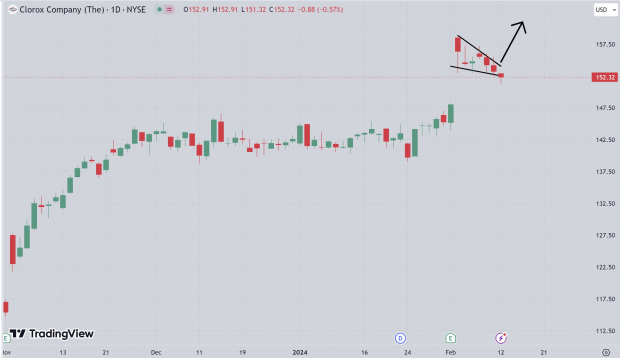
Image Source: TradingView
The price action chart for HCA Healthcare HCA showcases a classic bull flag formation, on the brink of a breakout. A move above $308 indicates a swift upward shift, while a drop below $302 prompts investors to explore alternative options.
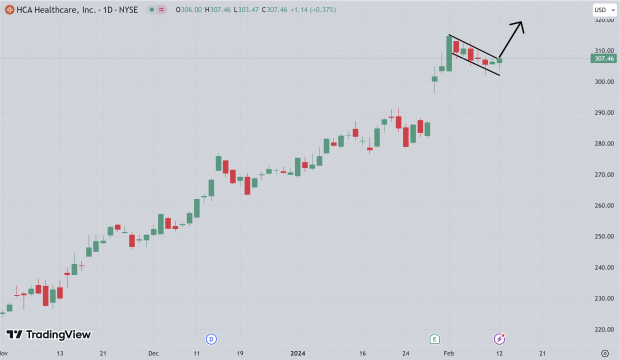
Image Source: TradingView
Next, observe the compelling technical chart pattern in Netflix NFLX. A convincing bull flag has taken shape, with a breakout confirmed above $566. Conversely, a dip below $550 necessitates patience for another opportunity.
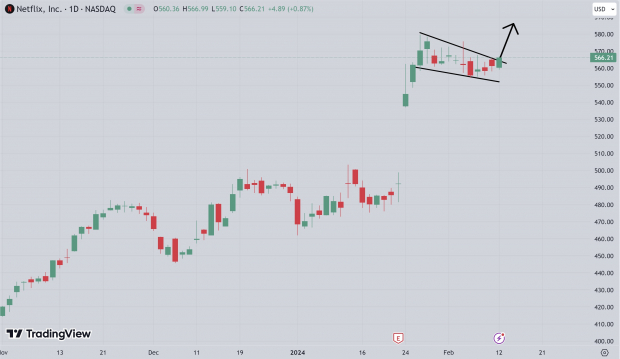
Image Source: TradingView
Continual Bullish Formations in Meta Platforms META, following an astounding 18-month performance, exhibits persistent bullish patterns. Similar to its counterparts, a substantial earnings gap up and the development of a bullish pattern are evident. A move above $474.40 is poised to attract even more buyers. Alternatively, a reversal or a breakdown below $453 warrants a wait for another setup.
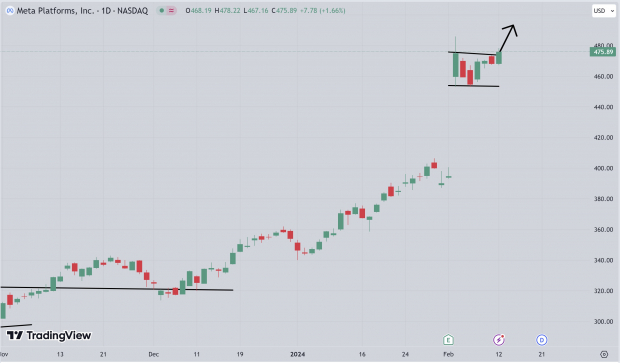
Image Source: TradingView
In Conclusion
Investors should gear up for an eventful week, marked by crucial economic data and significant earnings releases, against the backdrop of a surging semiconductor sector and compelling technical trade setups in high-Zacks Ranked stocks.