
Utilities Sector Faces Midday Struggles Amid Broader Market Trends
The Utilities sector is leading the declines as of midday Monday with a 1.5% decline. Noteworthy within this sector, PG&E Corp (Symbol: PCG) has dropped 5.1%, while Exelon Corp (Symbol: EXC) follows with a 2.6% loss. For those tracking utilities, the Utilities Select Sector SPDR ETF (Symbol: XLU) is down 1.7% today, yet it remains up 31.22% for the year. In terms of year-to-date performance, PG&E Corp has increased 14.00% and Exelon Corp is up 11.54%. Together, these two companies account for around 5.7% of XLU’s underlying assets.
Energy Sector Also Shows Signs of Weakness
Following utilities, the Energy sector reports a 1.3% decline. The largest downward movements among energy stocks come from Targa Resources Corp (Symbol: TRGP) and Williams Cos Inc (Symbol: WMB), which have recorded losses of 4.3% and 2.7%, respectively. The Energy Select Sector SPDR ETF (XLE), closely aligned with energy stocks, has seen a 1.2% decrease in midday trading but maintains a year-to-date increase of 15.14%. Notably, Targa Resources Corp has surged 128.12% year-to-date, while Williams Cos Inc has gained 67.51% within the same timeframe, and together, they represent about 4.0% of XLE’s holdings.
Trailing Twelve Month Performance Review
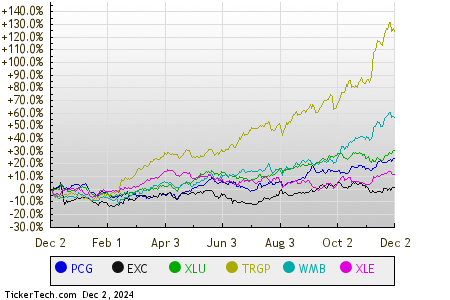
Shifting focus to the long-term, a comparative chart displays the relative stock price performance of each symbol over the last twelve months:

S&P 500 Sector Performance Snapshot
As the market continues to evolve, here’s an overview of how various S&P 500 sectors are performing in afternoon trading on Monday. Currently, three sectors show positive change while five sectors face declines.
| Sector | % Change |
|---|---|
| Technology & Communications | +1.3% |
| Consumer Products | +0.3% |
| Services | +0.2% |
| Healthcare | 0.0% |
| Industrial | -0.1% |
| Materials | -0.1% |
| Financial | -0.9% |
| Energy | -1.3% |
| Utilities | -1.5% |
![]()
![]() 10 ETFs With Stocks That Insiders Are Buying »
10 ETFs With Stocks That Insiders Are Buying »
Also see:
• Materials Stocks Hedge Funds Are Buying
• ETON market cap history
• BEAM market cap history
The views and opinions expressed herein are the views and opinions of the author and do not necessarily reflect those of Nasdaq, Inc.


