

Nasdaq 100 Falls Below Key Average Amid Economic Concerns
The Nasdaq 100 index dropped 13% from its all-time high reached on February 18, 2025. It currently stands 4% below its important 200-day moving average, a key technical indicator historically associated with significant buying opportunities.
This decline in major technology stocks has been driven by rising concerns over higher tariffs, a slowdown in economic growth, and persistent inflation. These factors have unsettled investors and triggered widespread strategies focused on reducing risk.
The Atlanta Fed’s GDPNow model anticipates a 2.4% contraction in the U.S. economy for the first quarter of 2025. This marks a significant shift from its previous forecast of 2.3% growth released in mid-February.
Goldman Sachs has also revised its 2025 U.S. GDP outlook downward, reducing it from 2.4% to 1.7% due to expectations of much higher tariffs.
Ed Yardeni, president of Yardeni Research, suggests that the market might already be experiencing a deeper downturn.
“We can’t rule out that a bear market started on February 20. If the sell-off persists, the negative wealth effect could increase the likelihood of a recession, widening the federal budget deficit and raising the debt-to-GDP ratio,” he noted.
Conversely, not all experts share this bearish view. Larry Tantarelli, chief technical strategist for Blue Chip Daily Trend, offers a more optimistic perspective.
“This environment remains driven by news and is highly volatile. Any positive news—particularly concerning tariffs—could lead the Nasdaq 100 (NDX) to experience a sharp recovery,” he asserted.
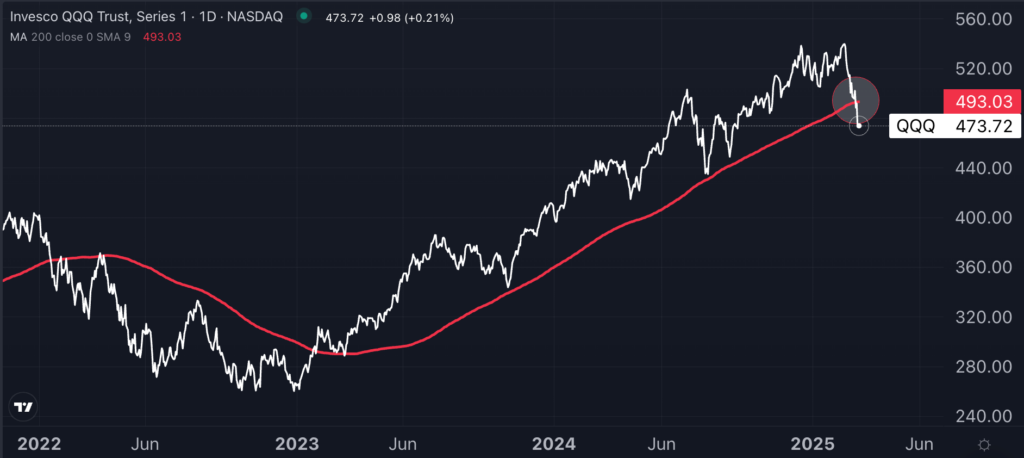
Chart: Benzinga Pro
The 200-day moving average is a crucial technical indicator widely monitored in financial circles.
It reflects the average closing price over the last 200 trading days, often regarded as a pivotal line between long-term bullish and bearish trends.
Renowned investor Paul Tudor Jones once remarked, “My metric for everything I look at is the 200-day moving average of closing prices. I’ve seen too many things go to zero, stocks and commodities. The whole trick in investing is: ‘How do I keep from losing everything?’ If you use the 200-day moving average rule, then you get out. You play defense, and you get out.”
When the Nasdaq 100, tracked by the Invesco QQQ Trust QQQ, falls under this threshold, it indicates weakness, yet history suggests it has also presented strong buying opportunities.
In the past, the Nasdaq 100 has rebounded robustly after dropping below its 200-day average.
In four out of the last five occurrences, the index saw double-digit gains in the ensuing months.
The average return over three months in these cases was 11%, while the one-year return averaged 29.4%, highlighting that investors buying during these downturns frequently realized profits over time.
However, there was a notable exception in 2022 when broader economic uncertainty and aggressive Fed tightening led to extended losses, resulting in a long-lasting bear market for technology stocks.
| Date | 1-Month Forward | 3-Month Forward | 6-Month Forward | 1-Year Forward |
|---|---|---|---|---|
| March 10, 2023 | +10.1% | +22.3% | +29.9% | +51.9% |
| Jan. 22, 2022 | -6.4% | -6.0% | -17.8% | -22.2% |
| March 9, 2020 | +5.7% | +24.4% | +39.3% | +61.1% |
| June 3, 2019 | +12.8% | +8.4% | +19.2% | +35.0% |
| March 7, 2019 | +8.4% | +10.9% | +8.1% | +21.3% |
| Average | +6.1% | +11.0% | +15.7% | +29.4% |
The current decline of the Nasdaq 100 below its 200-day moving average could signify a significant buying opportunity, yet investors must evaluate the broader macroeconomic situation carefully.
Historical trends suggest that the market often rebounds strongly following similar declines, often resulting in double-digit returns.
Nonetheless, potential risks linger, including escalating tariffs, a slowdown in economic growth, and uncertainties surrounding the Federal Reserve’s interest rate adjustments.
The immediate focus will likely be February’s inflation report.
Should the upcoming Consumer Price Index numbers be better than anticipated, it could encourage optimism about possible rate cuts, resulting in a market rally. Conversely, stubbornly high inflation could exacerbate the current downward trend.
Read now:
Photo: iQoncept via Shutterstock
© 2025 Benzinga.com. Benzinga does not provide investment advice. All rights reserved.


