Exxon Mobil Unveils New Options with November 21st Expiration
New options for Exxon Mobil Corp (Symbol: XOM) became available today, with an expiration date of November 21st. These contracts offer investors a chance to possibly earn higher premiums due to the 171 days until they expire, compared to shorter-term options.
One notable contract is the $90.00 put option, which currently bids at $1.27. Selling this put commits the investor to buy shares at $90.00 while also earning the premium. This brings the effective cost basis to $88.73 per share, offering a more attractive purchase price than the current market price of $103.28.
The $90.00 strike is approximately 13% below the current trading price, making it out-of-the-money by that percentage. Current analytics suggest an 81% chance that this put option will expire worthless. Stock Options Channel will monitor these odds over time and provide updates on their website. If the put expires worthless, the premium represents a 1.41% return on cash commitment, or 3.01% annualized, termed as YieldBoost.
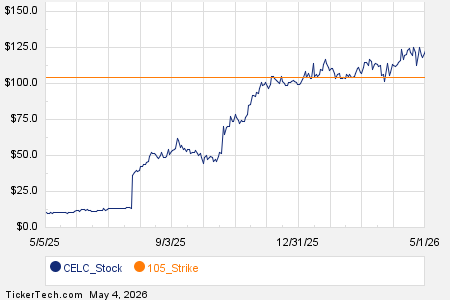
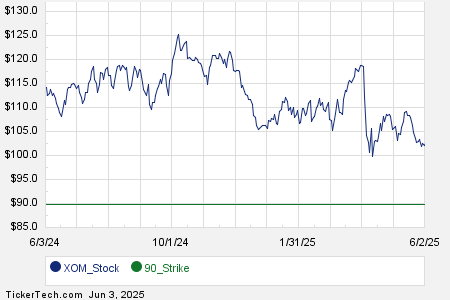
Below is a chart showing Exxon Mobil’s trailing twelve-month trading history, highlighting the position of the $90.00 strike:

On the call side, the $105.00 call option is currently bid at $5.95. If an investor buys XOM shares at $103.28 and sells this call, they agree to sell at $105.00. This setup could yield a total return of 7.43% if the stock is called away at expiration, not accounting for dividends.
The $105.00 strike price is around 2% above the current share price, which presents a chance that this call option could also expire worthless. Current analytics show a 49% chance of that happening. If so, the investor retains both shares and collected premium, which would represent a 5.76% additional return, or 12.29% annualized, also branded as YieldBoost.
The implied volatility for the put option is 26%, while the call option sits at 27%. In contrast, we determined the actual trailing twelve-month volatility, based on the last 250 trading days, to be 24%. For additional options insights, visit StockOptionsChannel.com.
![]()
![]() Top YieldBoost Calls of S.A.F.E. Dividend Stocks »
Top YieldBoost Calls of S.A.F.E. Dividend Stocks »
Additional Insights:
- GPOR Historical Stock Prices
- Top Ten Hedge Funds Holding OZSC
- FPI Shares Outstanding History
The views and opinions expressed herein are the views and opinions of the author and do not necessarily reflect those of Nasdaq, Inc.
5 Stocks Our Experts Predict Could Double In the Next Year
By submitting your email, you'll also get a free pivot & flow membership. A free daily market overview. You can unsubscribe at any time.