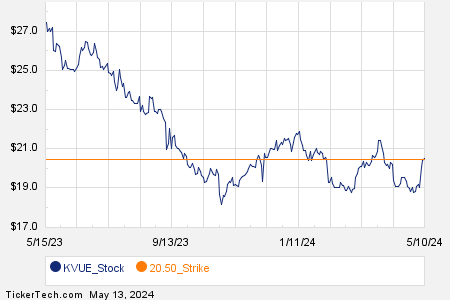
Looking at options trading activity among components of the S&P 500 index, there is noteworthy activity today in Kenvue Inc (Symbol: KVUE), where a total volume of 86,786 contracts has been traded thus far today, a contract volume which is representative of approximately 8.7 million underlying shares (given that every 1 contract represents 100 underlying shares). That number works out to 48.7% of KVUE’s average daily trading volume over the past month, of 17.8 million shares. Especially high volume was seen for the $20.50 strike put option expiring May 17, 2024, with 21,669 contracts trading so far today, representing approximately 2.2 million underlying shares of KVUE. Below is a chart showing KVUE’s trailing twelve month trading history, with the $20.50 strike highlighted in orange:

Eli Lilly (Symbol: LLY) options are showing a volume of 13,446 contracts thus far today. That number of contracts represents approximately 1.3 million underlying shares, working out to a sizeable 46.3% of LLY’s average daily trading volume over the past month, of 2.9 million shares.
Especially high volume was seen for the $740 strike put option expiring May 17, 2024, with 540 contracts trading so far today, representing approximately 54,000 underlying shares of LLY. Below is a chart showing LLY’s trailing twelve month trading history, with the $740 strike highlighted in orange:

And Hershey Company (Symbol: HSY) saw options trading volume of 8,578 contracts, representing approximately 857,800 underlying shares or approximately 44.8% of HSY’s average daily trading volume over the past month, of 1.9 million shares.
Especially high volume was seen for the $190 strike put option expiring June 21, 2024, with 1,442 contracts trading so far today, representing approximately 144,200 underlying shares of HSY. Below is a chart showing HSY’s trailing twelve month trading history, with the $190 strike highlighted in orange:

For the various different available expirations for KVUE options, LLY options, or HSY options, visit StockOptionsChannel.com.
![]()
![]() Today’s Most Active Call & Put Options of the S&P 500 »
Today’s Most Active Call & Put Options of the S&P 500 »
Also see:
DLA Insider Buying
CDR Options Chain
NGAC market cap history
The views and opinions expressed herein are the views and opinions of the author and do not necessarily reflect those of Nasdaq, Inc.