Shares of Novo Nordisk Plunge After Disappointing Trial Results
Novo Nordisk A/S NVO experienced a dramatic decline in its stock value, dropping 20% on Friday after unveiling results from its latest Phase 3 clinical trial, which did not meet expectations.
Beyond the disappointing trial headlines, deeper analysis reveals concerning trends within the stock’s performance.
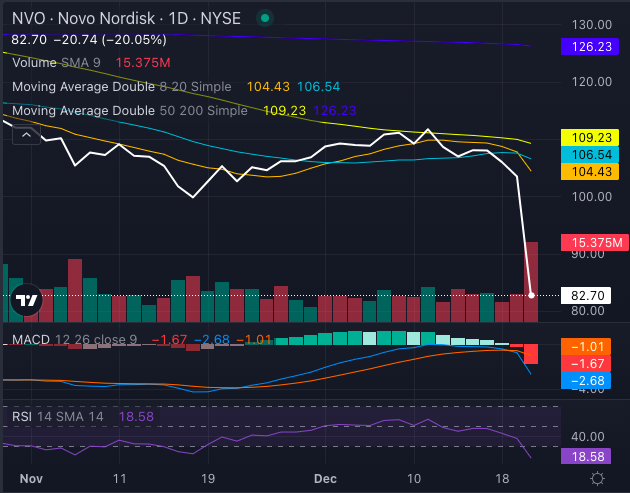
Chart created using Benzinga Pro
Technical Indicators Show Weakness in NVO Stock
Current charts for NVO reveal prevalent bearish signals, indicating a lack of strength in the stock’s performance.
Here’s an overview of the technical indicators at play:
- Exponential Moving Averages (EMAs): NVO is trading below its five, 20, and 50-day EMAs, indicating a clear downtrend. Consistent trading below these averages signifies weak bullish momentum, suggesting additional declines may occur soon.
- Simple Moving Averages (SMAs): The stock price currently sits at $82.70, which is well below its eight-day SMA of $104.43, 20-day SMA of $106.54, and 50-day SMA of $109.23. These averages act as resistance, reinforcing the downward sentiment. The price is also significantly beneath the 200-day SMA of $126.23, further confirming the ongoing downtrend.
- MACD (Moving Average Convergence Divergence): A MACD reading of negative 2.68 highlights negative momentum. This suggests that short-term averages are falling below long-term averages, emphasizing the absence of upward pressure and potential for continued selling.
- RSI (Relative Strength Index): Currently, NVO’s RSI is at 18.58, a historically low level indicating oversold conditions. While such levels can suggest a potential bounce back, the overall bearish trend raises doubts about the sustainability of any recovery attempts.
At this point, NVO stock is entrenched in a strong downtrend with minimal signs of relief from current selling pressure.
Read Next:
Photo: Shutterstock
Market News and Data brought to you by Benzinga APIs