March 12, 2025
Significant Midweek Options Trading: SEI, VST, CVNA Insights
March 12, 2025
“VONV Sees Surge in Seller Activity”
March 12, 2025
Invesco S&P 500 Equal Weight (RSP) Hits Oversold Levels: Implications for Investors
March 12, 2025
“Significant Capital Inflow Observed for iShares S&P 100 ETF”
March 12, 2025
Analyzing the Strength of American Century U.S. Quality Growth ETF (QGRO) in Today’s Market
March 12, 2025
“Top 3 Growth Stocks Poised for Profitable Returns”
March 12, 2025
Target’s Q4 Earnings Report: Time to Buy or Sell the Stock?
March 12, 2025
Wednesday Market Update: Consumer Products and Services Lag Behind
March 12, 2025
“Midweek Market Highlights: Key Performers in Energy, Tech, and Communications”
March 12, 2025
“Analyzing Kimberly-Clark’s Performance Against the Consumer Defensive Sector”
March 12, 2025
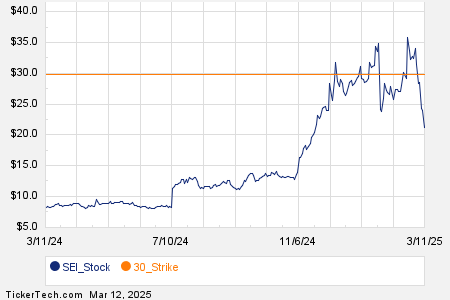
Significant Options Activity in Russell 3000 Components Today Today, options trading is notable among the Russell 3000 index components, particularly for Solaris Energy Infrastructure Inc (Symbol: SEI). A total of 10,435 contracts have been traded today, equating to roughly 1.0 million underlying shares. This volume represents 71% of SEI’s daily average of 1.5 million shares over the past month. Significant activity centered on the $30 strike call option set to expire on March 21, 2025, with 3,500 contracts trading, which corresponds to approximately 350,000 underlying shares of SEI. The following chart depicts SEI’s trailing twelve-month trading history, with the highlighted … Read more
March 12, 2025
“VONV Sees Surge in Seller Activity”
Ron Finklestien
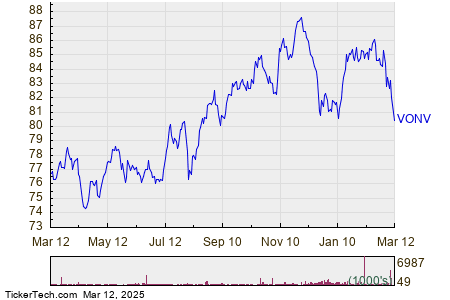
Vanguard Russell 1000 Value ETF Hits Oversold Territory On Wednesday, trading reports indicated that shares of the Vanguard Russell 1000 Value ETF (Symbol: VONV) dropped into oversold territory, with prices as low as $80.55 per share. This determination is made using the Relative Strength Index (RSI), a technical analysis tool that measures momentum on a scale from zero to 100. A stock is classified as oversold when its RSI falls below 30. For the Vanguard Russell 1000 Value ETF, the RSI reading currently stands at 29.8. Comparatively, the S&P 500’s RSI is slightly lower at 29.7. This suggests that the … Read more
March 12, 2025
Invesco S&P 500 Equal Weight (RSP) Hits Oversold Levels: Implications for Investors
Ron Finklestien
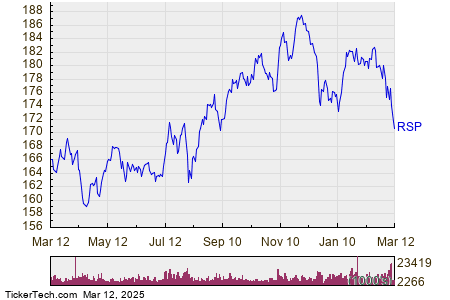
Invesco S&P 500 Equal Weight ETF Shows Signs of Being Oversold On Wednesday, shares of the Invesco S&P 500 Equal Weight ETF (Symbol: RSP) traded at a low of $170.98, indicating that they have entered oversold territory. This assessment relies on the Relative Strength Index (RSI), a technical analysis tool that measures momentum on a scale from zero to 100. An asset is considered oversold when its RSI falls below 30. Currently, RSP has recorded an RSI of 29.6. For comparison, the S&P 500 shows an RSI reading of 29.7. This suggests that the recent selling pressure on RSP might … Read more
March 12, 2025
“Analyzing Kimberly-Clark’s Performance Against the Consumer Defensive Sector”
Kimberly-Clark’s Strong Market Position Amidst Analyst Caution Kimberly-Clark Corporation (KMB), with a market cap of $47.8 billion, stands as a leading manufacturer and marketer of personal care and hygiene products. The company operates through three main segments: Personal Care, Consumer Tissue, and K-C Professional. Its notable brands include Huggies, Kotex, Depend, Kleenex, Scott, and Cottonelle, which serve both consumer and professional markets As a “large-cap” stock, Kimberly-Clark’s valuation exceeds $10 billion. Located in Dallas, Texas, it markets its products globally through various distribution channels, including supermarkets, mass merchandisers, drugstores, e-commerce platforms, and institutional outlets. Active Investor: FREE newsletter going behind … Read more
March 12, 2025
PFF Surpasses Key Technical Benchmark
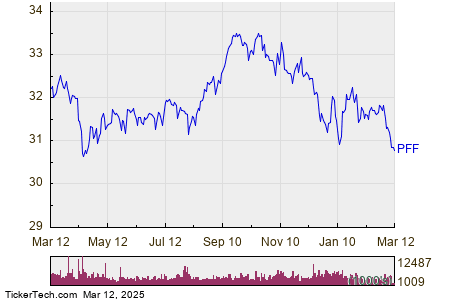
PFF Shares Hit Oversold Status Amid Market Fluctuations On Wednesday, shares of the iShares Preferred and Income Securities ETF (Symbol: PFF) dipped into oversold territory, reaching a low of $30.80 per share. The Relative Strength Index (RSI), a momentum indicator that ranges from zero to 100, is used to determine this status. A stock is classified as oversold when its RSI falls below 30. For iShares Preferred and Income Securities, the RSI has measured 29.95. For comparison, the current RSI for the S&P 500 stands at 29.7. A bullish investor might interpret PFF’s RSI reading of 29.95 as an indication … Read more
March 12, 2025
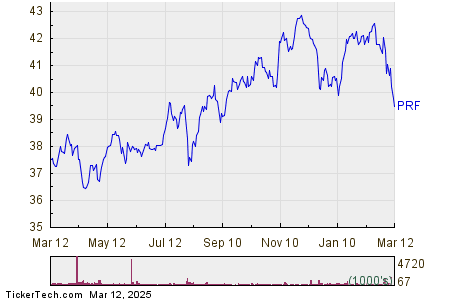
Invesco FTSE RAFI US 1000 (PRF) Approaches Oversold Levels: What Investors Should Know
Invesco FTSE RAFI US 1000 ETF Shares Enter Oversold Territory On Wednesday’s trading session, shares of the Invesco FTSE RAFI US 1000 ETF (Symbol: PRF) dipped into oversold territory, reaching a low of $39.63 per share. Oversold conditions are determined using the Relative Strength Index (RSI), a technical analysis tool that measures momentum on a scale from zero to 100. A stock is deemed oversold when its RSI falls below 30. Currently, the RSI for Invesco FTSE RAFI US 1000 stands at 28.8, while the S&P 500’s RSI is slightly higher at 29.7. A bullish investor might interpret this 28.8 … Read more
