
Market Faces Uncertainty After Tariff Increases Impact Stocks
“tariff increases will be significantly larger than expected…”
– Fed Chairman Jerome Powell, April 4, 2025
“…investors hoped that the tariffs unveiled at the president’s ‘Liberation Day’ wouldn’t be so extensive. The president might back off. The threats might be a short-term negotiating tactic. Fewer countries than expected might be included. Instead, the levies were even worse than what most anticipated.”
– The Wall Street Journal, April 3, 2025
As many investors are aware, monitoring sentiment and expectations is crucial when evaluating risks and rewards in trading and investing. Following the recent stock market crash instigated by President Trump’s announcement of worldwide tariffs last Wednesday, understanding the stark selloff can be derived from the preceding quotes and excerpts.
Fed Chair Jerome Powell’s comments highlighted the situation: “larger than expected” tariffs were anticipated not to be extensive by investors. Given the U.S.’s deep involvement in a growing global economy, the market’s optimistic expectations were met with drastic disillusionment when faced with the reality of extensive tariff increases.
The fallout was profound; stocks plummeted while the Cboe Market Volatility Index (VIX) rose to 45.31, the highest level since August 2024. This spike in the VIX signifies growing uncertainty regarding how these unexpected tariffs may influence economic growth.
This market reaction represents a significant unwind of hope. The stock market had already shown signs of distress from a technical standpoint. Although sentiment had softened compared to the more optimistic views of December and January, recent events suggest that there remains a considerable amount of optimism yet to evaporate.
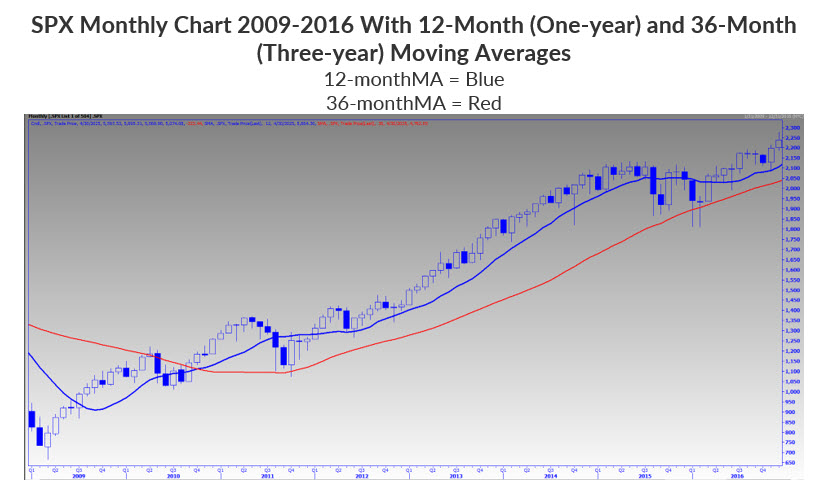
“Be prepared for anything to happen and be open to all possibilities beyond Monday. This is more pertinent than ever… we risk an end-of-month close below the SPX’s 12-month moving average. Since 2010, there were six times the SPX closed below its 12-month trendline at the end of the month. In five of those instances, the index went on to decline to at least its 36-month moving average before a new high.… The only good news for bulls is that the SPX’s 36-month moving average is sloping higher…The bad news is that this trendline is currently sitting at 4,735, or 15% below Friday’s 5,580 close. If downside of this magnitude is in the cards, option buyers can snag portfolio protection to hedge such a scenario, and one can also profit with minimal risk to leverage downside as a speculative tool. If you are looking to prepare for various outcomes, developing an option-buying strategy is an excellent first step.”
– Monday Morning Outlook, March 31, 2025
The emphasized remarks in my previous commentary, which were not underlined at the time, have since proven prescient. Following the S&P 500 Index’s (SPX) month-end closure below its 12-month moving average, the SPX swiftly declined nearly 10% last week.
While I did not predict this drastic fall, it aligns with the idea of being prepared for unexpected outcomes. Those who considered my advice on options as portfolio protection likely minimized losses or even gained from the current chaotic market conditions.
As I mentioned, the SPX’s 36-month moving average remains vulnerable to testing and potentially breaching in the near future. With a current value of 4,765, approximately 6% below the recent close, breaching this moving average could mean approaching the 50-month moving average, currently resting at 4,656—about 100 points beneath the 36-month line.
Interestingly, the 50-month moving average aligns with a 38.2% Fibonacci retracement level from the Covid lows of 2020 to the February highs.


The SPX is currently around 20% below its all-time closing high of 4,915 and has dropped below the major low from early August at 5,120, a decline partially influenced by delta-hedge selling. This positions the market dangerously close to a bear market, suggesting that sentiment indicators may need to hit more extreme levels than usual before a market bottom is established.
The classic marker for a bear market is a 20% drop; however, long-term moving averages, such as breaches of the 36-month or 50-month averages, offer a clearer insight based on both time and price.
Next, let’s focus on short-term conditions. “Tradeable” rallies may be possible given the current volatility, but sustained moves could also occur. If we see a tradeable rally, I anticipate that Thursday’s close around 5,400—prior to Friday morning’s gap down—could serve as the first significant resistance level. This point also corresponds to where buyers showed up during pullbacks in late July and mid-September of 2024.
If selling continues, the first potential support level appears to be around the 5,000 milestone, marking a key low in April 2024. A mere 85 points below this threshold is 4,915, which coincides with the 20% drop from the February closing high. Notably, the SPX peak in February nearly mirrored a 20% rise above the August low, making 4,915 equivalent to roughly 490 on the SPDR S&P 500 ETF Trust (SPY), where notable buying volume emerged in the April standard expiration series, potentially giving this strike “magnet” potential going forward.
Market Analysis: Rising Pessimism and Technical Challenges Ahead

We have experienced significant technical damage in the market, not only last week but also over the preceding weeks. Given these conditions, it’s likely we will need to observe more extremes in sentiment measures before a sustainable market trough can be established.
Current Market Sentiment and Technical Indicators
Over the past year, for the S&P 500 (SPX) components, the 10-day buy-to-open put/call volume ratio would likely need to reach levels between 0.60 and 0.70 for a notable trough to form. However, this occurred under a more robust market backdrop.
Historically, we have seen readings between 0.90 and 1.00 that correspond to weaker markets. A few weeks ago, I noted enough pessimism to suggest a potential bottom, but the necessary improvement in technical indicators never materialized. Consequently, we may need to see significantly greater pessimism before establishing a market bottom.

Short Interest Trends and Potential Risks
The second chart illustrates the short interest of SPX components. I have previously stated that multi-year highs in short interest can be a bullish sign, provided there isn’t major technical deterioration. In recent weeks, we have indeed witnessed such deterioration, potentially emboldening shorts and reducing the likelihood of forced covering due to margin calls. Additionally, while total short interest remains at multi-year highs, it hasn’t reached the extremes seen during the 2015-2016 market period.
Fund Allocation and Market Sentiment Insights
Fund managers have scaled back equity allocations, although these levels are neither particularly high nor excessively low by historical norms. Anecdotally, there seems to be some optimism to shake out, with discussions about potential tariff negotiations being seen as a positive sign—better than the prospect of increasing tariffs.
That said, scenarios like global alliances forming against the U.S., prolonging these rates beyond expectations, should not be ignored. While this is not a predetermined outcome, the overall market sentiment does not appear to be dominated by outright fear.
Conclusion: Navigating a Volatile Market Environment
It’s essential to remember that uncertainty and bear markets are part of the financial landscape. Given this unpredictability, options were developed to hedge against risks, profit in declining markets with less capital at stake, or speculate on potential rallies. Make sure you have an options strategy in your toolkit, as they are effective in accommodating all market environments.

Todd Salamone is Schaeffer’s Senior V.P. of Research
Continue Reading:
![]()
The views and opinions expressed herein are the views and opinions of the author and do not necessarily reflect those of Nasdaq, Inc.


