

Applied Materials Set to Report Q2 FY’25 Earnings Highlights
Applied Materials (NASDAQ:AMAT) is preparing to report its Q2 FY’25 earnings in the coming weeks. Analysts forecast a revenue increase of approximately 7% year-over-year, bringing total expected revenues to $7.12 billion. Earnings per share are projected to rise to about $2.31, compared to $2.09 in the same period last year. Several trends are driving these earnings, particularly the growing demand for advanced equipment linked to applications like generative AI and the transition to advanced process technologies.
The surge in AI technology is contributing to the increased demand for semiconductors, reflecting a need for enhanced computational power, larger memory capacities, and more sophisticated chip designs. However, it’s worth noting that the company indicated in February that U.S. government restrictions on selling leading-edge chipmaking equipment to Chinese firms might temper growth in this quarter.
Currently, Applied Materials reports a market capitalization of $122 billion. Over the past twelve months, the company generated revenues of $27.2 billion, with net profits amounting to $7.2 billion.
Historical Earnings Performance and Market Reactions
Applied Materials’ Historical Odds Of Positive Post-Earnings Return
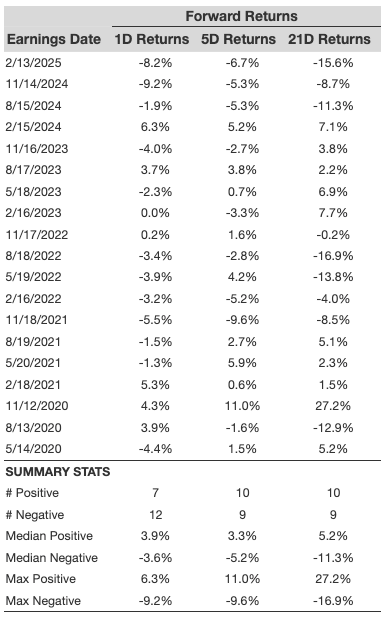
Considering the data from the last five years, there were 19 recorded earnings data points. Out of these, 7 indicated positive returns, while 12 experienced negative
The median increase for the 7 positive returns is 3.9%, while the median decrease for the 12 negative returns is -3.6%.
Further observations for the 5-day (5D) and 21-day (21D) returns following earnings are summarized in the accompanying table.
Understanding Correlation in Returns
Correlation Between 1D, 5D, and 21D Historical Returns
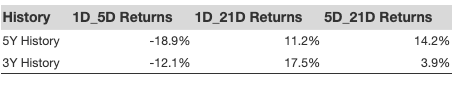
A prudent approach to mitigate risk involves understanding the correlation between short-term and medium-term returns following earnings releases. Identifying pairs with strong correlation can guide trading decisions. For instance, if 1D and 5D returns show a high correlation, a trader might consider a “long” position for the following 5 days after a positive 1D return. The data below illustrates the correlations based on both 5-year and recent 3-year history.
Peer Influence on Earnings and Stock Reaction
Is There Any Correlation With Peer Earnings?
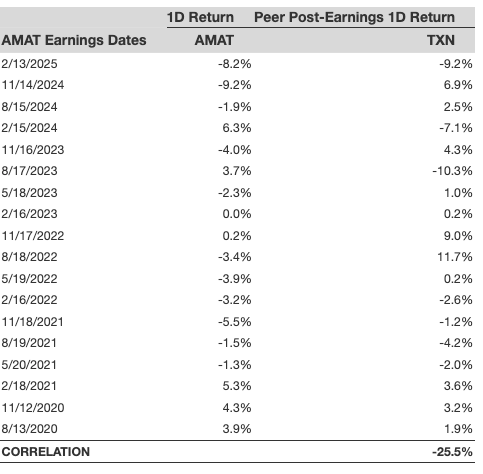
The performance of peers can influence the stock reaction to earnings announcements. In some cases, market pricing may begin even before earnings results are released. Historical data shows how Applied Materials’ stock performance compares with peers that reported earnings prior. For a fair evaluation, peer stock returns also reflect post-earnings one-day returns.
The views and opinions expressed herein are the views and opinions of the author and do not necessarily reflect those of Nasdaq, Inc.


