

Chevron Set to Reveal Q1 Earnings Amid Declining Profit Projections
Chevron Corporation (NYSE: CVX) will release its fiscal first-quarter earnings on Friday, May 2, 2025. Analysts anticipate earnings of $2.15 per share, totaling $48.39 billion in revenue. If met, this would indicate a 28% drop in earnings year-over-year, despite a 4% increase in sales compared to last year’s figures of $2.97 per share and $46.74 billion in revenue. Historically, Chevron’s stock has often declined after earnings announcements, with 53% of announcements resulting in an average one-day drop of 3.5% and a peak decline of 7%.
Chevron has indicated that demand could soften, influenced by U.S. tariffs and OPEC’s increased production, yet it remains steadfast in its capital spending strategy. The company boasts a robust financial standing, reflected by a market capitalization of $238 billion, trailing twelve-month revenue of $193 billion, and a net income of $18 billion. Upcoming performance will heavily hinge on actual results aligning with consensus estimates, but historical trading patterns may suggest potential downside risks for event-driven investors assessing short-term strategies.
Event-Driven Trading Insights
For event-driven traders, understanding historical patterns may offer a strategic edge, whether preemptively positioning for earnings or responding to market movements afterward. If you prefer less volatility compared to individual stocks, considering alternative portfolios, such as high-quality funds, might be advantageous, particularly those that have historically outperformed indices like the S&P 500.
 Image by AdmiralFox from Pixabay
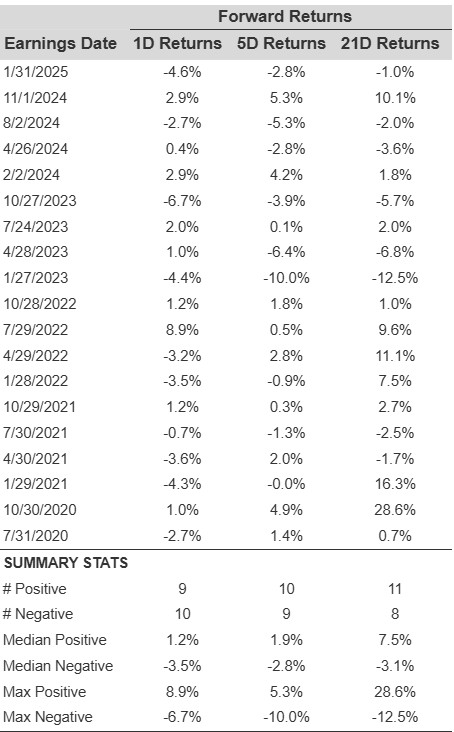
Chevron’s Historical Odds of Positive Post-Earnings Return
Here are some key observations regarding one-day (1D) post-earnings returns:
- Over the last five years, there are 19 recorded earnings data points, resulting in 9 positive and 10 negative 1D returns. This indicates that positive returns occurred approximately 47% of the time.
- This percentage increases to 64% when examining the last three years instead of five.
- The median of the 9 positive returns is 1.2%, while the median of the 10 negative returns is -3.5%.
Correlation Between 1D, 5D, and 21D Historical Returns
Understanding the correlation between short-term and medium-term returns post-earnings is a more cautious strategy. Finding pairs with the highest correlation helps traders execute informed decisions. For instance, if there is a strong correlation between 1D and 5D returns, a trader can consider going long for five days if the 1D post-earnings return is favorable. Here is some correlation data derived from the 5-year and 3-year historical perspectives. Note that the correlation 1D_5D refers to the relationship between 1D post-earnings returns and subsequent 5D returns.
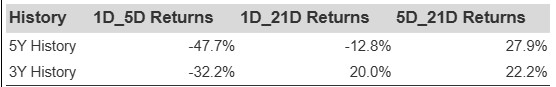
CVX Correlation Between 1D, 5D, and 21D Historical Returns
The views and opinions expressed herein are those of the author and do not necessarily reflect those of Nasdaq, Inc.


