Analysts See Potential Upside for Major ETFs and Stocks
At ETF Channel, we’ve analyzed the underlying holdings of various ETFs in our coverage universe. We compared the trading price of each holding to the average analyst 12-month forward target price. This analysis allowed us to compute the weighted average implied analyst target price for the SPDR SSGA US Large Cap Low Volatility Index ETF (Symbol: LGLV), which stands at $190.22 per unit.
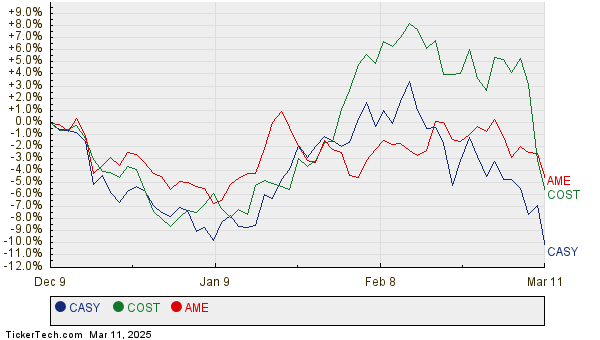
Currently, LGLV is trading around $173.21 per unit. This indicates an expected upside of 9.82% based on analyst target prices for the ETF’s underlying holdings. Notably, three underlying holdings of LGLV show significant potential upside: Casey’s General Stores, Inc. (Symbol: CASY), Costco Wholesale Corp (Symbol: COST), and AMETEK Inc (Symbol: AME).
CASY, trading at $381.68 per share, has an average analyst target of $439.31, representing a potential upside of 15.10%. Similarly, COST shares are currently priced at $934.41, but analysts predict a target price of $1,069.38, indicating a 14.44% upside. AME, with a recent price of $179.37, has an analyst target of $204.58, suggesting a possible increase of 14.06%. Below is a twelve-month price history chart comparing the performance of CASY, COST, and AME:

Here is a summary table of the current analyst target prices discussed above:
| Name | Symbol | Recent Price | Avg. Analyst 12-Mo. Target | % Upside to Target |
|---|---|---|---|---|
| SPDR SSGA US Large Cap Low Volatility Index ETF | LGLV | $173.21 | $190.22 | 9.82% |
| Casey’s General Stores, Inc. | CASY | $381.68 | $439.31 | 15.10% |
| Costco Wholesale Corp | COST | $934.41 | $1,069.38 | 14.44% |
| AMETEK Inc | AME | $179.37 | $204.58 | 14.06% |
Investors may wonder if analysts are justified in their target prices or if they are overly optimistic regarding future trading levels for these stocks. Understanding the rationale behind these targets could highlight the influence of recent company and industry developments. Moreover, a high target relative to a stock’s trading price may indicate optimism, but it can also signal potential downgrades if the targets do not reflect current realities. Further investor research is necessary to navigate these considerations.
![]()
![]() 10 ETFs With Most Upside To Analyst Targets »
10 ETFs With Most Upside To Analyst Targets »
Also see:
• Trane Technologies Average Annual Return
• Institutional Holders of NVRI
• WSTL YTD Return
The views and opinions expressed herein are the views and opinions of the author and do not necessarily reflect those of Nasdaq, Inc.