Market Volatility Signals Investment Opportunities Following Record S&P 500 Moves
Over the long term, stocks have consistently outperformed other asset classes in average annual returns. However, navigating Wall Street can be turbulent, as demonstrated in recent weeks.
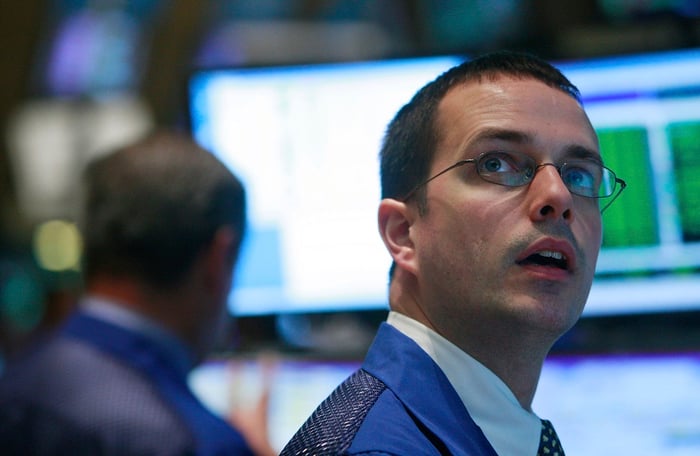
In the past two weeks, the Dow Jones Industrial Average (DJINDICES: ^DJI), the broad-based S&P 500 (SNPINDEX: ^GSPC), and the innovation-driven Nasdaq Composite (NASDAQINDEX: ^IXIC) experienced significant fluctuations. All three major indexes recorded some of their largest one-day point changes recently. For instance, the S&P 500 experienced its fifth-largest two-day drop in history with a decline of 10.5% on April 3 and 4, followed by its largest one-day point gain of 474.13 points and an 8th largest percentage rise of 9.52% on April 9.
Where to invest $1,000 right now? Our analysts have revealed their picks for the 10 best stocks to consider now. Learn More »
While historic market volatility often raises fear and uncertainty, it can also create valuable investment opportunities. The recent anomalous behavior of the S&P 500 suggests that the right moment for investors to act may be approaching.

Image source: Getty Images.
Understanding the Forces Behind the Stock Market’s Historic Volatility
Many investors are questioning the causes behind the extraordinary market shifts seen recently. A significant factor appears to be President Donald Trump’s tariff policy.
On April 2, dubbed ‘Liberation Day,’ Trump announced a sweeping 10% global tariff, along with several reciprocal tariffs, particularly targeting countries with unfavorable trade balances with the U.S.
A week later, Trump paused these reciprocal tariffs for 90 days, excluding China. Relations with China have only intensified, allowing tariffs between the two nations to escalate.
This ongoing uncertainty regarding tariff modifications has unsettled investors, hindering their long-term outlook. Additionally, the Trump administration’s failure to differentiate between input and output tariffs risks raising U.S. goods prices, potentially increasing inflation at a time when U.S. economic growth for the first quarter appears to be faltering.
The situation is further complicated by the stock market entering 2025 at the third-highest valuation premium in 154 years, according to the S&P 500’s Shiller price-to-earnings (P/E) Ratio. Historically, when the Shiller P/E exceeds 30—as it did in this case—it often precedes significant declines in major indexes such as the Dow Jones, S&P 500, and Nasdaq Composite, each losing a minimum of 20% of their value.
Additionally, last week saw the 30-year Treasury bond yields rise at the fastest rate in over four decades, as reported by UBS economist Paul Donovan. Rising yields generally make borrowing costlier for consumers and businesses, potentially slowing economic growth. Combine this with tariffs that may inflate prices, and the outlook becomes even more concerning.
As it stands, there are no quick fixes to these challenges, suggesting that market volatility may persist in the coming weeks and months.

Image source: Getty Images.
The S&P 500’s Uncommon Performance Signals Hope for Investors
During periods of significant fluctuations in the Dow Jones, S&P 500, and Nasdaq Composite, investors often turn to data and historical events to forecast future performance. Although predicting the stock market is inherently uncertain, certain indicators carry a high probability of recurrence.
April 9 marked one of the S&P 500’s best days, recording a 9.52% increase—only the 24th time since 1950 that the index gained 5% or more in one session.
Interestingly, history shows that after such substantial gains, investors typically take time to reflect. Data from Carson Investment Research, shared on social media by Chief Market Strategist Ryan Detrick, indicates that the S&P 500 fell 65% of the time (15 out of 23 instances) the day after a 5% gain. Following Detrick’s observation preceding the closing bell on April 10, the S&P 500 did end lower the next day, reinforcing the trend of subsequent declines.
The trend extends into the week following these sizeable gains, with the S&P 500 adding to its gains only 39% of the time (9 out of 23 instances).
Some weakness the day after, and out to a week after, some of the best days ever is pretty normal. pic.twitter.com/rJq1zEQJKb
— Ryan Detrick, CMT (@RyanDetrick) April 10, 2025
However, examining the longer-term data presents a different narrative. Over the 12 months following the previous occurrences where the S&P 500 gained at least 5% in a single session, the index recorded gains 91% of the time (21 out of 23). Notably, two exceptions occurred during the dot-com bubble and immediately following the Great Recession.
Additionally, the S&P 500 has historically performed well in the year following these rare significant gains. On average, the index rose by 26.9% in the year following such outcomes, including years with downturns.
Understanding S&P 500 Returns and Investment Opportunities
The S&P 500 has showcased a remarkable annual increase of around 10% since 1957. Historically, days marked by extraordinary returns have often been predictors of significant gains in the following year.
It is essential to clarify that there is no assurance the S&P 500 will achieve a nearly 27% return in the next year or even surpass its closing value on April 9. However, over a stretch of more than a century, the index has never demonstrated a negative total return, including dividends, over any rolling 20-year period.
Market fluctuations, including corrections and crashes, have consistently provided strategic buying opportunities for disciplined investors, regardless of the underlying causes of the volatility.
Considering a $1,000 Investment in the S&P 500 Index
If you’re thinking about investing in the S&P 500 Index right now, here are some points to ponder:
The Motley Fool Stock Advisor analyst team recently spotlighted what they believe are the 10 best stocks to invest in at this moment, and the S&P 500 Index did not make the list. The selected stocks have strong potential for significant returns as the years progress.
Reflect on previous recommendations: When Netflix was recommended on December 17, 2004, a $1,000 investment would have grown to approximately $495,226!* Similarly, on April 15, 2005, a $1,000 investment in Nvidia would now be worth about $679,900!*
It’s important to mention that Stock Advisor boasts a total average return of 796%, significantly outperforming the 155% return of the S&P 500. Make sure to catch the latest top 10 list by joining Stock Advisor.
*Stock Advisor returns as of April 14, 2025
Sean Williams holds no investment positions in the mentioned stocks. The Motley Fool has shares in and recommends FactSet Research Systems. For more details, please consult the Motley Fool’s disclosure policy.
The views and opinions expressed herein are those of the author and do not reflect the opinions of Nasdaq, Inc.


