Historic Stock Market Volatility and What It Means for Investors
For most of the last century, the stock market has been a reliable wealth generator. While other assets like gold, Treasury bonds, and real estate have also increased investor wealth, none have matched the annualized returns of stocks. However, examining a narrower timeline reveals the challenges investors face along the way.
Since mid-February, when the S&P 500 (SNPINDEX: ^GSPC) reached its peak, all three major U.S. stock indexes have experienced double-digit percentage declines. The well-established Dow Jones Industrial Average (DJINDICES: ^DJI) and S&P 500 now find themselves in correction territory, while the growth-focused Nasdaq Composite (NASDAQINDEX: ^IXIC) officially entered a bear market as of April 8.

Image source: Getty Images.
The speed of these movements has captured attention. April saw the Dow, S&P 500, and Nasdaq Composite achieve the largest single-session point gains in their histories while also recording some of the steepest declines. The S&P 500’s 10.5% drop over two days on April 3 and April 4 was its fifth-worst decline since 1950.
Such heightened volatility often breeds fear and uncertainty on Wall Street. However, historically, some of the market’s darkest moments have been followed by strong returns.
Record Volatility in the Stock Market
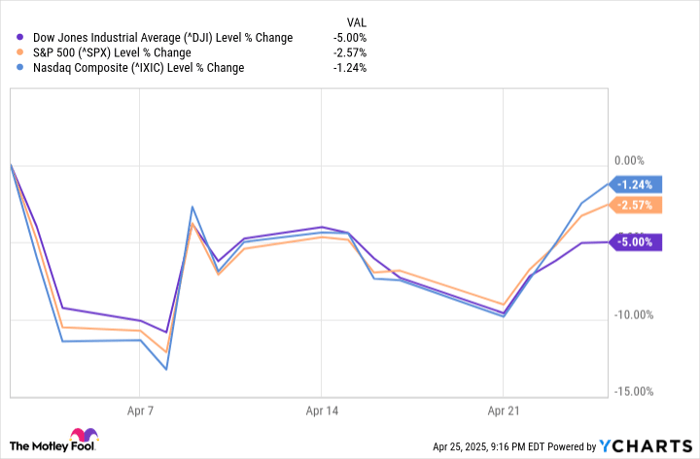
April delivered historic levels of volatility, largely due to President Donald Trump’s tariff policy. On April 2, Trump announced a 10% global tariff and outlined higher “reciprocal tariffs” affecting multiple countries with trade deficits with the U.S. While these tariffs were largely paused on April 9, the initial announcement was instrumental in producing record single-day gains across major indexes.

Market fluctuations have been significant since the tariff announcements. ^DJI data by YCharts.
Concerns remain about the real-world impact of tariffs, which may result in higher domestic prices, squeezing profit margins and potentially affecting hiring. Additionally, the inconsistency from the Trump administration regarding tariffs has created uncertainty, making it hard for Wall Street to gauge future market conditions.
As stocks entered 2025 at historically high valuations, the S&P 500’s Shiller price-to-earnings (P/E) ratio reached nearly 39 in December, significantly higher than the long-term average of 17.23. Although this ratio isn’t a timing tool, it has previously predicted downturns after indicators crossed the 30 mark during bull markets, leading to declines of at least 20% in major indexes.

Image source: Getty Images.
A Positive Signal for Investors from Recent Market Activity
As we analyze the causes behind the recent market fluctuations, an intriguing event last week presents a potentially positive outlook for long-term investors. Typically, Wall Street does not make headlines for simply having up days. However, the occurrence of three consecutive up days on April 22, 23, and 24, signaled increased market breadth.
Market breadth refers to the ratio of stocks that advance relative to those that decline on an exchange. A low percentage reflects fear, while a higher percentage suggests optimism. Over 70% of publicly listed companies on the New York Stock Exchange (NYSE) advanced for those three days, marking the 29th occurrence of such a trend in 75 years.
More than 70% advancers on the NYSE for 3 days in a row. Hasn’t hit 4 since April 2020.
Strong returns across the board after this type of buying thrust. Higher a year…
# Strong Market Signals Suggest Positive S&P 500 Future
The U.S. stock market is showing encouraging signs, particularly within the S&P 500 index. Recent data reveals that after specific bullish trends in New York Stock Exchange (NYSE) market breadth, the index tends to perform well.
Historical Performance of Market Breadth
According to Ryan Detrick, Chief Market Strategist at Carson Group, the S&P 500 rose 26 out of 27 times—an impressive 96.3% success rate—one year after experiencing three-day periods of optimistic market breadth. This analysis draws from data provided by Ned Davis Research.
Moreover, the potential returns from these periods are significant. Historically, the 27 instances documented resulted in an average gain of 18.9%, which far exceeds the S&P 500’s average annual return of 9.2% since 1950. Even though Wall Street carries inherent risks, such periods of robust breadth often signal market bottoms, representing favorable buying opportunities.
Market Outlook Amid Political Developments
Investors should remain cautious, as short-term volatility is expected across major indices like the Dow Jones Industrial Average, S&P 500, and Nasdaq Composite. This caution arises from ongoing policy adjustments related to tariffs and trade negotiations. Nevertheless, the long-term outlook for these indices remains positive.
Investment Considerations for the S&P 500 Index
Before investing in the S&P 500 Index, prospective investors should evaluate alternative options. The Motley Fool’s investment analysts have identified ten stocks they believe offer superior growth potential. Notably, these selections did not include the S&P 500 Index.
For instance, had an investor placed $1,000 in Netflix when it was recommended in December 2004, that investment would be worth $594,046 today. Similarly, an investment in Nvidia since April 2005 would have grown to $680,390. These examples underline the potential rewards of selective stock investing.
Furthermore, the average return of the Motley Fool’s recommended stocks totals 872%, compared to 160% for the S&P 500 over the same timeframe. This track record highlights the advantages of focusing on high-performing individual stocks.
Investors are encouraged to research broadly and consider various options before committing capital to the S&P 500.
Sean Williams has no position in any of the stocks mentioned. The Motley Fool has no position in any of the stocks mentioned. The Motley Fool has a disclosure policy.
The views and opinions expressed herein are those of the author and do not necessarily reflect the views of Nasdaq, Inc.