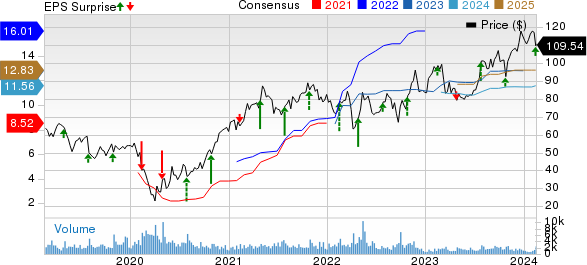
Ryder System, Inc. (R) showcased its resilience in the fourth quarter of 2023, as its earnings per share (EPS) of $2.95 surpassed the Zacks Consensus Estimate of $2.75. However, the bottom line experienced a 24.2% decline compared to the previous year, mainly due to subdued market conditions in used vehicle sales and rental. This was partly offset by improved Supply Chain Solutions outcomes.
Total revenues reached $3,023 million, topping the Zacks Consensus Estimate of $2,944.4 million. Nevertheless, the top line saw a 2.1% year-over-year decrease, largely attributed to lower commercial rental revenues in Fleet Management Solutions. Operating revenues of $2,447 million demonstrated a 2% increase from the previous year.
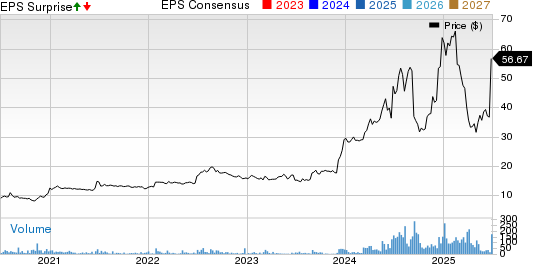
Ryder’s Performance Chart
Ryder System, Inc. price-consensus-eps-surprise-chart | Ryder System, Inc. Quote
Breakdown of Business Segments
Fleet Management Solutions: The segment’s total revenues of $1,481 million experienced a 7% year-over-year dip due to lower fuel costs passed through to customers and a decrease in operating revenues. Operating revenues summed $1,271 million, down 4% year over year, primarily due to lower rental demand, partially offset by higher ChoiceLease revenues.
Supply-Chain Solutions: This segment’s total revenues of $1,301 million inched up 4% year over year, driven by higher operating revenues, partially offset by reduced subcontracted transportation and fuel costs passed through to customers. Operating revenues rose 10% year over year to $972 million, attributable to organic growth from new business, increased pricing, higher volumes, and the Impact Fulfillment Services, LLC acquisition.
Dedicated Transportation Solutions: The segment’s total revenues reached $443 million, reflecting a 3% decline from the prior year. This was due to lower fuel costs and subcontracted transportation passed through to customers, partially offset by higher operating revenues. Operating revenues climbed 1% to $324 million, powered by inflationary cost recovery.
Liquidity and Future Projections
Ryder ended the fourth quarter with cash and cash equivalents of $204 million, an improvement from $159 million at the end of the prior quarter. Total debt (including the current portion) was $7,114 million at the fourth-quarter end, compared with $6,621 million at the end of the previous quarter.
In terms of future outlook, for the first quarter of 2024, Ryder expects adjusted EPS in the range of $1.55-$1.80. For the full year 2024, the company foresees substantial growth, with anticipated total revenues and operating revenues both likely to increase by about 13%. Adjusted EPS for the year is estimated to be between $11.50 and $12.50. Net cash from operating activities is projected to be $2.4 billion, and the adjusted return on equity (ROE) is suggested to be in the 15%-16.5% range. Capital expenditure is estimated to be $3.3 billion.
The company currently holds a Zacks Rank #3 (Hold).
Performance of Other Transportation Companies
J.B. Hunt Transport Services, Inc. (JBHT) reported a fourth-quarter 2023 EPS of $1.47, but it missed the Zacks Consensus Estimate of $1.74 and experienced a 23.4% year-over-year decline.
Delta Air Lines (DAL) has reported fourth-quarter 2023 EPS of $1.28, comfortably beating the Zacks Consensus Estimate of $1.17. However, earnings declined 13.51% on a year-over-year basis due to high labor costs.
United Airlines Holdings, Inc. (UAL) reported fourth-quarter 2023 EPS of $2.00, which outpaced the Zacks Consensus Estimate of $1.61 but declined 18.7% year over year.
Want the latest recommendations from Zacks Investment Research? Today, you can download 7 Best Stocks for the Next 30 Days. Click to get this free report
Delta Air Lines, Inc. (DAL) : Free Stock Analysis Report
United Airlines Holdings Inc (UAL) : Free Stock Analysis Report
J.B. Hunt Transport Services, Inc. (JBHT) : Free Stock Analysis Report
Ryder System, Inc. (R) : Free Stock Analysis Report
To read this article on Zacks.com click here.
The views and opinions expressed herein are the views and opinions of the author and do not necessarily reflect those of Nasdaq, Inc.


