In trading on Thursday, the Leverage Shares 2X Long SBUX Daily ETF (Symbol: SBU) saw its shares drop to $17, entering oversold territory with a Relative Strength Index (RSI) reading of 29.8. A stock is considered oversold when the RSI falls below 30; for context, the S&P 500’s RSI is currently at 69.4.
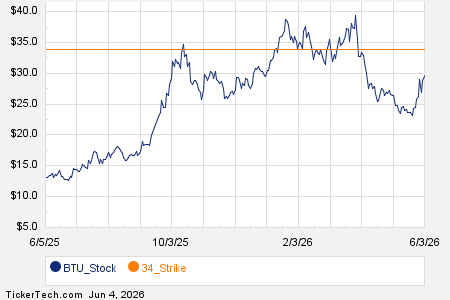
SBU’s performance over the past year shows a low of $13.92 and a high of $23.14, with the last trade at $17.01, reflecting a decline of approximately 3.6% on the day. Investors may view the oversold condition as a potential buying opportunity as recent heavy selling appears to be exhausting.
5 Stocks Our Experts Predict Could Double In the Next Year
By submitting your email, you'll also get a free pivot & flow membership. A free daily market overview. You can unsubscribe at any time.