iShares U.S. Financials ETF Falls Below 200-Day Moving Average
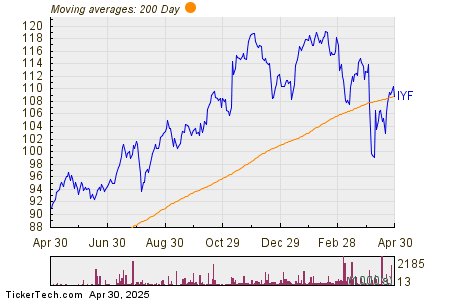
During trading on Wednesday, shares of the iShares U.S. Financials ETF (Symbol: IYF) declined below their 200-day moving average of $108.90, reaching a low of $107.82 per share. Currently, IYF shares are down approximately 1.9% for the day. The following chart illustrates the one-year performance of IYF in relation to its 200-day moving average:

According to the chart, IYF’s 52-week low stands at $91.32 per share, while its 52-week high is $119.90. The most recent trade price was noted at $108.94.
![]()
![]() Click here to discover which 9 other ETFs have also recently crossed below their 200-day moving average.
Click here to discover which 9 other ETFs have also recently crossed below their 200-day moving average.
Additional Resources:
- ABHD Insider Buying
- MSBI Price Target
- ETFs Holding NEOS
The views and opinions expressed herein are those of the author and do not necessarily reflect the views of Nasdaq, Inc.