SPDR Portfolio S&P 500 Value ETF Sees Significant Inflows
ETFs Experience Notable Week-Over-Week Changes
Looking at recent changes in shares outstanding among various ETFs, the SPDR Portfolio S&P 500 Value ETF (Symbol: SPYV) stands out. An inflow of approximately $164.0 million has been detected, marking a 0.6% increase in outstanding units. The total increased from 483,252,864 to 486,352,864 units.
Among SPYV’s largest holdings today, Berkshire Hathaway Inc (Symbol: BRK.B) declined about 0.3%, Thermo Fisher Scientific Inc (Symbol: TMO) fell approximately 0.8%, and Walt Disney Co. (Symbol: DIS) is down about 0.3%. For more details on these holdings, refer to the SPYV Holdings page »

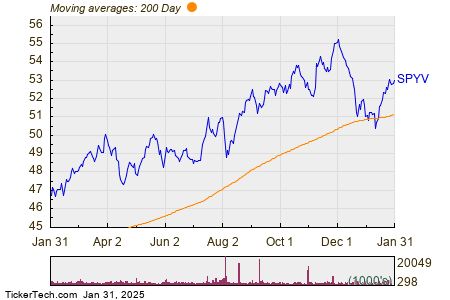
The chart above shows SPYV’s one-year price performance compared to its 200-day moving average. The ETF’s 52-week low stands at $46.42 per share, while the high reached $55.415. The latest trading price is $53.02, which serves as a valuable point of comparison against the 200-day moving average for technical analysis—learn more about the 200-day moving average ».
Exchange-traded funds (ETFs) operate similarly to stocks; however, investors buy and sell “units” instead of shares. These units can be traded just like stocks but are also subject to creation and destruction based on investor demand. Each week, we track changes in shares outstanding for ETFs to identify those experiencing significant inflows (many new units created) or outflows (many old units destroyed). The creation of new units means purchasing the underlying assets of the ETF, while destruction involves selling those assets. Thus, large flow changes can significantly impact the individual components within ETFs.
![]() Click here to find out which 9 other ETFs had notable inflows »
Click here to find out which 9 other ETFs had notable inflows »
Other Interesting Reads:
- Cheap Utilities Stocks
- UP Market Cap History
- KIND Options Chain
The views and opinions expressed herein are those of the author and do not necessarily reflect the views of Nasdaq, Inc.


