iShares MSCI USA Quality Factor ETF Sees Significant Inflows
Market Movements and Key Components
This week, the iShares MSCI USA Quality Factor ETF (Symbol: QUAL) has attracted considerable investor interest, with an inflow of approximately $415.1 million. This represents a 0.8% increase in outstanding units, rising from 279,850,000 to 282,200,000. Notably, Eli Lilly (Symbol: LLY) has experienced a drop of about 7%, while TJX Companies (Symbol: TJX) has gained around 0.5%. Additionally, Alphabet Inc (Symbol: GOOGL) has risen by about 0.2%. For a detailed list of holdings, you can check the QUAL Holdings page.
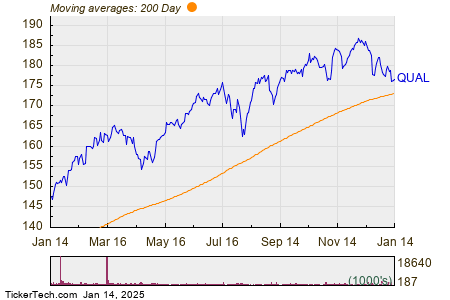
The chart below illustrates the price performance of QUAL over the past year, highlighting its relationship with the 200-day moving average:

Examining the performance, QUAL’s 52 week low stands at $146.41 per share, while the high is $187.26. The most recent trading price is $176.59. Investors often use the comparison between the current share price and the 200-day moving average as a technical analysis tool — learn more about the significance of the 200-day moving average.
Understanding ETF Shares and Market Dynamics
Exchange-Traded Funds (ETFs) operate similarly to stocks, with “units” being bought and sold instead of shares. These units can be traded back and forth and adjusted based on investor demand, leading to the creation or destruction of units. Each week, we track changes in shares outstanding to identify ETFs with significant inflows or outflows. When new units are created, the ETF must purchase its underlying holdings, while the destruction of units requires selling those holdings, which can influence the individual assets within the ETFs.
![]() Click here to discover which 9 other ETFs had notable inflows.
Click here to discover which 9 other ETFs had notable inflows.
Additional Resources:
- CVS shares outstanding history
- VTHR Videos
- KEN Average Annual Return
The views and opinions expressed herein are the views and opinions of the author and do not necessarily reflect those of Nasdaq, Inc.


