Significant Options Activity in KB Home, Core Scientific, and Oxford Industries
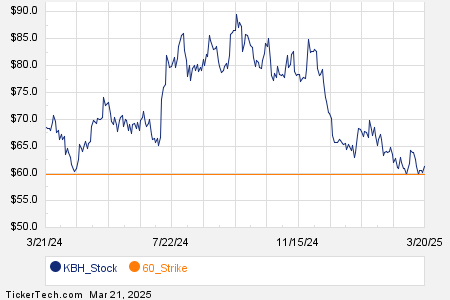
Today’s options trading activity in the Russell 3000 index reveals interesting patterns for several companies. Notably, KB Home (Symbol: KBH) has seen a total trading volume of 7,448 contracts so far today. This volume equates to about 744,800 underlying shares, given that each contract corresponds to 100 shares. This figure represents 62.7% of KBH’s average daily trading volume over the last month, which stands at 1.2 million shares. The most active contract has been the $60 strike put option expiring on March 21, 2025, with 3,548 contracts traded today, representing roughly 354,800 underlying shares of KBH. Below is a chart illustrating KBH’s trading history for the past twelve months, with the $60 strike highlighted in orange:

In addition, Core Scientific Inc (Symbol: CORZ) has reported a volume of 128,203 contracts trading today. This volume represents approximately 12.8 million underlying shares, making up 61.8% of CORZ’s average daily trading volume, which is 20.8 million shares. A significant portion of this activity has been focused on the $7 strike put option expiring on April 17, 2025, where 30,691 contracts have been traded, corresponding to about 3.1 million underlying shares of CORZ. Below is a chart depicting CORZ’s twelve-month trading history, with the $7 strike highlighted in orange:

Moreover, Oxford Industries, Inc. (Symbol: OXM) is witnessing a trading volume of 2,829 contracts today, which translates to approximately 282,900 underlying shares. This volume accounts for 61.2% of OXM’s average daily trading volume over the past month of 462,250 shares. A noteworthy spike in trading has occurred for the $60 strike call option set to expire on April 17, 2025, with 944 contracts exchanged today, representing about 94,400 underlying shares of OXM. Below is a chart showing OXM’s trailing twelve-month trading history, with the $60 strike visually identified in orange:

For more information on available options expirations for KBH, CORZ, or OXM, visit StockOptionsChannel.com.
![]()
![]() Today’s Most Active Call & Put Options of the S&P 500 »
Today’s Most Active Call & Put Options of the S&P 500 »
Also see:
- ABR Average Annual Return
- ETFs Holding MUR
- ARO Split History
The views and opinions expressed herein are those of the author and do not necessarily reflect those of Nasdaq, Inc.