Wall Street Rally and Economic Signals: What Investors Should Know for 2024
As 2024 came to a close, investors had plenty to cheer about. The Dow Jones Industrial Average (DJINDICES: ^DJI), S&P 500 (SNPINDEX: ^GSPC), and Nasdaq Composite (NASDAQINDEX: ^IXIC) finished the year with impressive gains of 13%, 23%, and 29%, respectively, while achieving multiple record highs. However, history reminds us that stock market movements aren’t always straightforward.
Understanding Market Trends and Economic Indicators
Investors are always seeking tools and data that might indicate shifts in the major stock indexes, helping them stay ahead. While no method guarantees precise predictions, some data points have shown a strong correlation with market movements over time.
One major concern now for investors is a significant change in the U.S. money supply, which hasn’t occurred in nearly a century.

Image source: Getty Images.
An Unusual Shift in U.S. Money Supply
The significant data point drawing attention on Wall Street is the change in U.S. money supply. There are various ways to measure money supply, but M1 and M2 are most notable. M1 includes cash, coins, demand deposits, and traveler’s checks, essentially representing money readily available for spending.
M2, on the other hand, includes everything in M1 and adds savings accounts, money market accounts, and CDs under $100,000. While M1 provides immediate spending power, M2 involves slightly more effort to access. Currently, M2 is the more concerning measure for investors.
Historically, M2 has generally increased over time alongside economic growth, signaling a rising demand for cash. However, notable declines in M2 historically precede economic troubles.
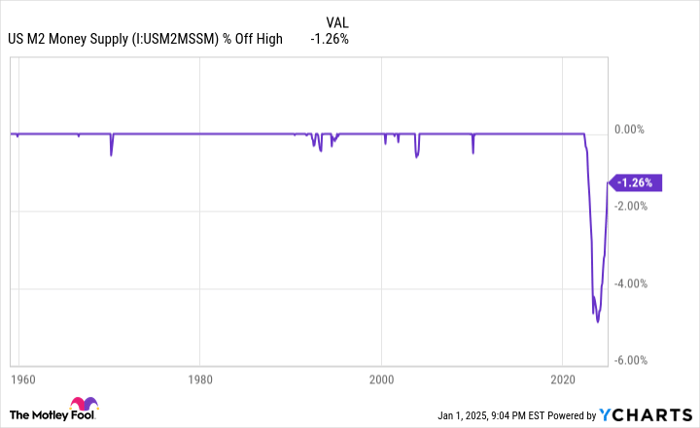
US M2 Money Supply data by YCharts.
In November 2024, M2 registered $21.448 trillion, down 1.26% from its peak of $21.723 trillion in April 2022. Between April 2022 and October 2023, M2 declined by $1.06 trillion, or 4.74%, marking the first annual drop over 2% since the Great Depression.
This decline in M2 has a complex backdrop. After the COVID-19 pandemic, fiscal stimulus drove M2 up by more than 26%. The recent downturn might simply be a correction following a rapid expansion lasting over 150 years. Encouragingly, M2 has started to grow year-over-year since October 2023, which is often a sign of a healthy economy.
That said, significant declines in M2 have always signaled potential economic issues.
WARNING: the Money Supply is officially contracting. 📉
This has only happened 4 previous times in last 150 years.
Each time a Depression with double-digit unemployment rates followed. 😬 pic.twitter.com/j3FE532oac
— Nick Gerli (@nickgerli1) March 8, 2023
This analysis shared by Nick Gerli underscores the correlation between significant yearly declines in M2 and economic performance since 1870. History shows only five instances where M2 fell by at least 2%—in 1878, 1893, 1921, 1931-1933, and 2023. Each was followed by economic downturns.
Today’s circumstances differ from past decades, as modern monetary policy tools and understanding provide a degree of protection against severe economic downturns. Nonetheless, concerns linger that a decrease in M2 during a period of high inflation might prompt consumers to limit spending, potentially leading to an economic slowdown that impacts corporate profits.
Data from Bank of America Global Research shows that two-thirds of S&P 500 declines occur post-recession declarations rather than before they happen.

Image source: Getty Images.
Long-Term Views Matter in Investing
Considering historical trends, 2024 may bring volatility and adjustments in the Dow Jones Industrial Average, S&P 500, and Nasdaq Composite. It’s essential to recognize that historical outlooks can change significantly based on investment timeframes.
Analysts at Crestmont Research have conducted extensive studies on the S&P 500’s 20-year returns, including dividends, since the early 1900s. While the S&P 500 was not officially established until 1923, researchers can trace its components back to 1900. They identified 105 rolling 20-year periods from 1919 to 2023.
Remarkably, Crestmont found that the S&P 500 has delivered positive total returns, including dividends, across all 105 timeframes.
Long-Term Investing: History Shows Patience Pays Off
Understanding Market Trends and Investor Strategies
If an investor had, hypothetically, purchased an S&P 500 tracking index at any point from 1900 through 2004 and simply held that position for 20 years, they would have made a profit every single time. A data set released in June 2023 by Bespoke Investment Group highlights the importance of patience and perspective on Wall Street.
It’s official. A new bull market is confirmed.
The S&P 500 is now up 20% from its 10/12/22 closing low. The prior bear market saw the index fall 25.4% over 282 days.
Read more at https://t.co/H4p1RcpfIn. pic.twitter.com/tnRz1wdonp
— Bespoke (@bespokeinvest) June 8, 2023
Researchers at Bespoke calculated the calendar-day lengths of every bear and bull market in the S&P 500, dating back to the start of the Great Depression in September 1929. Their data reveals that the 27 S&P 500 bear markets lasting an average of just 286 calendar days, or about 9.5 months. The longest recorded bear market, which occurred in the mid-1970s, lasted only 630 calendar days.
In contrast, the average bull market since the late 1920s has lasted 1,011 calendar days, or approximately two years and nine months. Moreover, more than half of the bull markets (14 out of 27), including the current one, have outlasted the longest S&P 500 bear market.
Despite short-term economic uncertainties, historical data clearly supports long-term investment strategies.
Exciting Investment Opportunities Await
Do you ever feel like you’ve missed out on the best stock purchases? Your next opportunity might be closer than you think.
Occasionally, our expert analysts issue a “Double Down” stock recommendation for companies poised for significant growth. If you’re anxious that the best investment window has passed, now might be the ideal moment to act before it’s too late. The success stories back up our confidence:
- Nvidia: If you invested $1,000 when we doubled down in 2009, you’d have $358,640!*
- Apple: If you invested $1,000 when we doubled down in 2008, you’d have $46,181!*
- Netflix: If you invested $1,000 when we doubled down in 2004, you’d have $478,206!*
Currently, we are issuing “Double Down” alerts for three outstanding companies, and another chance like this may not come around soon.
See 3 “Double Down” stocks »
*Stock Advisor returns as of December 30, 2024
Bank of America is an advertising partner of Motley Fool Money. Sean Williams has positions in Bank of America. The Motley Fool has positions in and recommends Bank of America. The Motley Fool has a disclosure policy.
The views and opinions expressed herein are the views and opinions of the author and do not necessarily reflect those of Nasdaq, Inc.

