Dimensional US Small Cap ETF Dips Below Key Moving Average
Shares of DFAS Fall Below $64.25, Marking a 2.6% Decrease
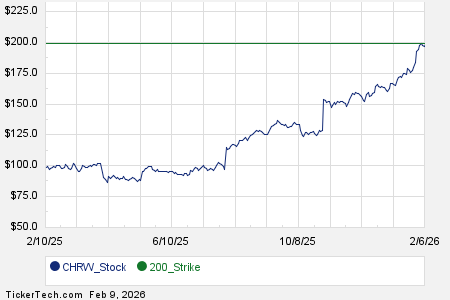
On Friday, the Dimensional US Small Cap ETF (Symbol: DFAS) saw its shares dip below the 200-day moving average of $64.25, trading as low as $64.24. Currently, DFAS is down approximately 2.6% for the day. Below is a graphic representing the ETF’s performance over the past year in relation to its 200-day moving average:

The chart indicates that DFAS’s lowest point in the last 52 weeks was $57.3256, while the highest was $71.78. The most recent trade price stands at $64.60.
Free Report: Top 8%+ Dividends (paid monthly)
![]()
![]() Click here to find out which 9 other ETFs recently crossed below their 200-day moving average »
Click here to find out which 9 other ETFs recently crossed below their 200-day moving average »
Also see:
- Top Ten Hedge Funds Holding FIIG
- Institutional Holders of AQ
- FVCB Insider Buying
The views and opinions expressed herein are the views and opinions of the author and do not necessarily reflect those of Nasdaq, Inc.