HYLB ETF Sees Significant Outflow of $83.9 Million
In a notable week for the HYLB ETF, investors pulled approximately $83.9 million, a decline of 2.4% in shares outstanding.
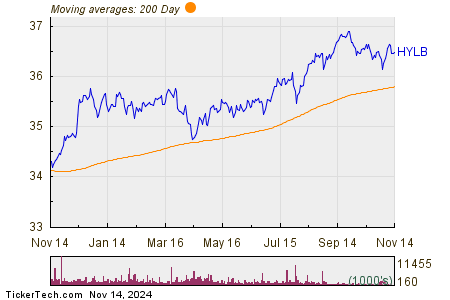
This change decreased the total from 97,387,501 shares to 95,087,501. The chart below illustrates HYLB’s price performance over the past year in relation to its 200-day moving average:

Over the past year, HYLB has traded between a low of $34.185 and a high of $36.94, with the latest price recorded at $36.51. Tracking the recent share price against the 200-day moving average can provide additional insights for investors.
Free Report: Top 8%+ Dividends (paid monthly)
Exchange-traded funds (ETFs) operate similarly to stocks, but instead of buying and selling “shares,” investors trade “units.” These units can be created or destroyed based on demand. Monitoring changes in shares outstanding weekly allows investors to identify ETFs experiencing significant inflows or outflows. When new units are created, the fund must purchase underlying assets, while destroying units entails selling these assets. Therefore, large movements can significantly affect individual securities within the ETF.
![]() Click here to find out which 9 other ETFs experienced notable outflows »
Click here to find out which 9 other ETFs experienced notable outflows »
Also see:
- FSCO Videos
- Institutional Holders of CXE
- Institutional Holders of EDMC
The views and opinions expressed herein are those of the author and do not necessarily reflect those of Nasdaq, Inc.


