Market Signals: Contrarian Indicators Suggest Bullish Trends Ahead
Jeff Clark’s Contrarian Indicator Points to Market Confidence
Is your spouse a contrarian indicator? Veteran trader Jeff Clark thinks his might be, and she has just sent out a positive signal.
In Jeff Clark Trader, Clark employs a variety of indicators and charting techniques to navigate the markets, whether they are trending up, down, or sideways.
Recently, one of his contrarian indicators was activated:
My wife mentioned she heard the Stock market is about to crash…
Gabriela entered my office and asked me a rare question in our 32 years together…
“How does the market look today?”
Clark notes that his wife, who runs a successful company, typically does not follow the Stock market or express opinions about it. Thus, her concern suggests significant market chatter.
He adds:
Her inquiry is an effective contrarian indicator, surfacing when there’s broader concern among the public.
After Initial Gains, Stocks Adjust Post-Federal Reserve Meeting
Following a rally after last Wednesday’s Federal Reserve meeting, stocks retreated yesterday, continuing their decline as of Friday morning. Should investors be worried?
Clark advises caution:
Being cautious is sensible. Trimming positions and raising cash during an oversold bounce can be wise.
However, making aggressive bets on a downturn is likely a misstep.
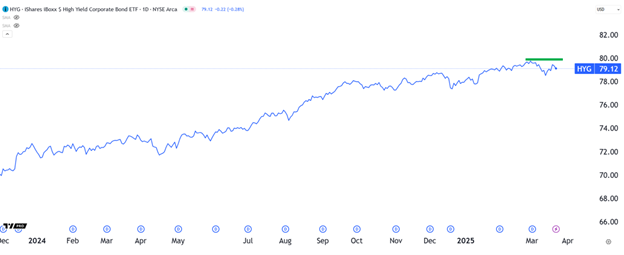
To illustrate, he points to the high-yield bond sector, a crucial indicator for the Stock market. Typically, when “junk” bonds rally, it indicates a risk-on environment, which is bullish for Stock prices. Conversely, a decline in high-yield bonds usually correlates with a risk-off sentiment among investors.
He highlights a significant observation:
The S&P 500 recently dropped 10% from its high and entered “correction” territory, yet the iShares iBoxx High Yield Corporate Bond ETF (HYG) is barely 1% shy of its all-time high.
As illustrated below, the movement of HYG presents a confident stance amidst the S&P’s pullback.

Source: TradingView
We will monitor this development and report if we notice any significant deterioration.
Other Analysts Share an Optimistic Outlook
It’s time to back up the truck, asserts Luke Lango, our hypergrowth and technology expert.
On Wednesday, Lango continued his buying spree, adding four new stock recommendations in Innovation Investor. This brings his total new recommendations for March to 25 across his Innovation Investor and Early Stage Investor services.
For context, Lango notes:
We’ve stated that stocks were at pivotal levels—ready to either surge or enter a bear market. The latest technical and fundamental data clearly suggests that the market is not breaking; rather, it’s making.
The Fed’s clear support for Wall Street indicates it’s time for aggressive buying.
Key Levels to Watch: Nasdaq-100 and S&P 500
According to Lango, two critical levels to observe are “19,440” on the Nasdaq-100 and the S&P 500’s 250-day moving average (MA).
The “19,440” mark is about 4% below the Nasdaq-100’s 200-day MA, a level Lango has identified as crucial for distinguishing between bullish and bearish market phases. Historically, holding at or bouncing from this level has led to significant gains in subsequent months.
Likewise, the S&P 500’s 250-day MA has served as a pivotal point, where a bounce often leads to substantial rallies over the following year.
As of now, the Nasdaq-100 is trading at 19,527, comfortably positioned above the “bull” threshold, although it remains below its 200-day moving average.
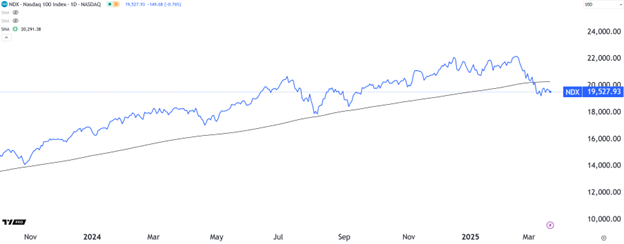
Source: TradingView
Additionally, the S&P 500 has recently dipped below its 250-day MA, then regained it, tested it as support, and continues to test it again, all indicative of a potential new rally.
Watch for U.S. Dollar Upturn: Potential Impact on Stock Markets
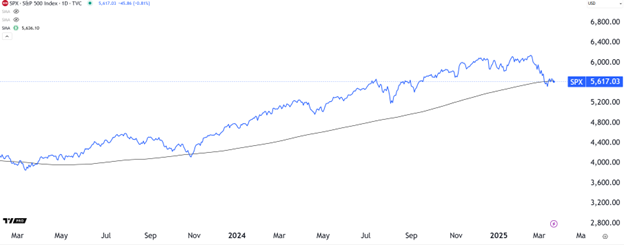
Source: TradingView
As subscribers can access Luke’s recent Innovation Investor recommendations, click here for more information.
While Jeff and Luke suggest a bullish trend ahead, investors should remain aware of one potential challenge…
Monitor the Recovery of the Falling U.S. Dollar
The U.S. Dollar Index has experienced a significant decline in 2025, as evidenced here.
Year-to-date, the dollar has lost more than 4%, as indicated by the data shown below.
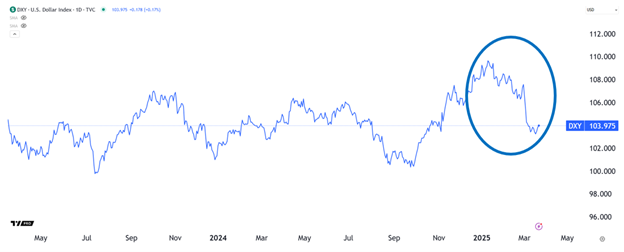
Source: TradingView
This decline is noteworthy, as the U.S. Dollar Index usually fluctuates within a 5% to 10% range annually; thus, a 4% drop in less than three months stands out.
Two main factors have driven this decline:
- Market expectations of Federal Reserve rate cuts this year
- Concerns over U.S. economic outlook influenced by President Trump’s trade policies
Nonetheless, two key technical indicators suggest that a bullish reversal may be on the horizon. If this occurs, it may pose a challenge to our growing stock market rally.
Assessing the Dollar Index through RSI and MACD Indicators
To examine this further, we turn to the Relative Strength Index (RSI) and the Moving Average Convergence Divergence (MACD) indicators.
For those new to the Digest, the RSI measures whether an asset is overbought or oversold.
A reading above 70 indicates an “overbought” condition, while a reading below 30 suggests an “oversold” state, often signaling a potential price reversal.
Conversely, the MACD assesses the strength, direction, and momentum of price trends. A bullish signal occurs when the MACD line crosses above its signal line.
In the chart below, we focus on a close-up view of the U.S. Dollar Index, showcasing the RSI and MACD indicators.
You’ll observe that the RSI has just emerged from “oversold” territory and is starting to rise.
Additionally, the MACD has shifted from a downward trend to an upward trajectory, nearing a bullish crossover with its signal line.
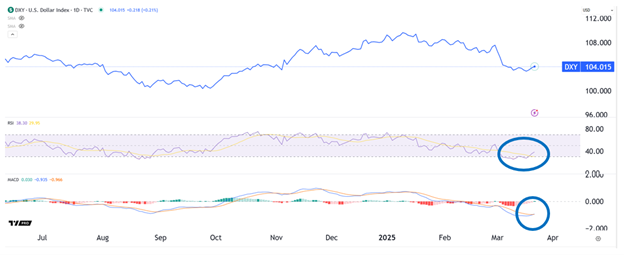
Source: TradingView
Implications of a Stronger U.S. Dollar on Stocks
An appreciating dollar usually has negative implications for U.S. stocks, particularly large-cap companies with substantial international exposure, such as Apple, Microsoft, and McDonald’s.
These companies may see reduced profits when converting foreign revenues into dollars during strengthening periods.
An intriguing dynamic is currently at play. Earlier this week, the Fed signaled expectations for two rate cuts in 2025. This would generally weaken the dollar, benefiting currency conversion.
If the dollar begins to rise consistently from this point, it may suggest that traders doubt the Fed’s predictions about future rate cuts. This scenario will be critical to monitor.
In summary, keep a close watch on the Dollar Index. It serves as another valuable tool in your investment strategy as we navigate the complexities of today’s market.
We’ll continue to update you on these developments here in the Digest.
Wishing you a good evening,
Jeff Remsburg