The Implication of William O’Neil
William J O’Neil was a renowned growth investor celebrated for implementing the CAN SLIM investment strategy. Throughout O’Neil’s extensive career, he amassed substantial wealth by investing in cutting-edge, high-growth stocks and most significantly, divesting them near their peak. Over many decades, O’Neil reaped profits from groundbreaking ideas and companies such as Costco, eBay, and Tesla.
The Art of Retaining Wealth
For growth investors, identifying profitable stocks is manageable. However, the real challenge lies in deciding when to sell, especially when they are rapidly appreciating. O’Neil excelled in this aspect by riding the ascent of internet-related stocks such as Qualcomm for extended periods before offloading them at the pinnacle. His success stemmed from studying numerous successful stocks and analyzing their peak patterns.
The Climactic Peak
One of O’Neil’s sell signals, relevant to the present context, is the Climax Top. According to O’Neil, many leading stocks culminate in an explosive manner, characterized by sudden rapid advances following months of growth. Furthermore, they often conclude with exhaustion gaps – where a stock’s price opens significantly higher than the prior day’s close, accompanied by heavy trading volume.
Key Aspects of the Climax Top
1. Largest daily price run-up: This cautionary sign manifests when a stock, which has been rallying for months, experiences its most significant point increase in the move.
2. Heaviest daily volume: Exceptionally high volume indicates that short sellers who were trapped have capitulated, while inexperienced buyers are chasing the surging stock.
3. Exhaustion gap: When a stock repeatedly gaps up from an extended move, it signals the final stage of the advance.
4. Climax top activity: An alert is raised if a stock experiences an exceptionally rapid upsurge over two to three weeks on a weekly chart or for seven to eight consecutive days on a daily chart.
A Case Study: QCOM in 1999
In 1999, the most scorching stock was the semiconductor manufacturer Qualcomm. As the internet frenzy gripped markets, QCOM skyrocketed from around $6 to $200 within a year. Eventually, the surge culminated in a classic climax top:
1. Largest point spread: On December 29, 1999, QCOM surged by $39 in a single session, marking its most substantial point increase to date.
2. Heaviest daily volume: Although not the all-time highest, the trading volume on December 29 soared by 142% compared to the 50-day average and represented the highest volume in weeks.
3. Exhaustion gap: After a prolonged uptrend, QCOM gapped up from an extended move, signaling exhaustion.***(It’s crucial to differentiate a gap up from a healthy base from one arising from an extended move, indicating exhaustion)***
4. Climax top activity: From December 13, 1999, to December 21, 1999, QCOM shares advanced for seven consecutive sessions – a warning sign.
Attached is the marked-up chart of QCOM in 1999. A valuable exercise would be to scrutinize each data point and correlate them with the chart and the commentary.
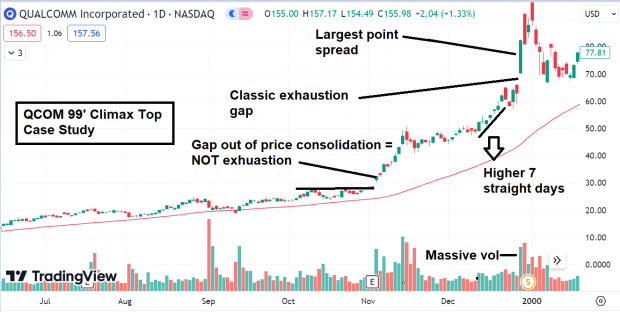
Image Source: TradingView
Following the peak in January 2000, QCOM shares did not reattain their climax top highs for another twenty years!
Super Micro Computer (SMCI): Shades of QCOM in ’99?
The Surge of Super Micro Computer, Inc. in the Market
Like QCOM in 1999, SMCI is a clear leader in today’s market. Over the past five years SMCI is up nearly 5,000%. Year-to-date (keep in mind we are in February), the bull trend has accelerated, and shares are up a mind-blowing 250%! Instead of the internet, the new frenzy on Wall Street is AI.
After such a breathtaking move, it’s worth looking at SMCI as a potential Climax Top situation. The stock gapped higher for a second straight day from an extended move, saw its highest trading volume in history (25 million shares, 244% above average), saw its largest one-day point spread ($123), and has gained ground for nine straight sessions (climactic activity).
To give you an idea of SMCI’s strength, the stock opened 2024 at ~$275, and today, gained $123 points for the day!
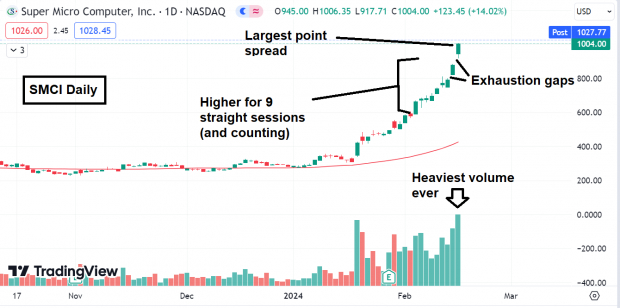
Image Source: TradingView
Bottom Line
The stock market is notoriously hard to predict, especially calling tops. However, SMCI has all the ingredients to a classic Climax Top pattern.
7 Best Stocks for the Next 30 Days
Just released: Experts distill 7 elite stocks from the current list of 220 Zacks Rank #1 Strong Buys. They deem these tickers “Most Likely for Early Price Pops.”
Since 1988, the full list has beaten the market more than 2X over with an average gain of +24.0% per year. So be sure to give these hand-picked 7 your immediate attention.
See them now >>
Want the latest recommendations from Zacks Investment Research? Today, you can download 7 Best Stocks for the Next 30 Days. Click to get this free report
QUALCOMM Incorporated (QCOM) : Free Stock Analysis Report
eBay Inc. (EBAY) : Free Stock Analysis Report
Costco Wholesale Corporation (COST) : Free Stock Analysis Report
Tesla, Inc. (TSLA) : Free Stock Analysis Report
Super Micro Computer, Inc. (SMCI) : Free Stock Analysis Report
To read this article on Zacks.com click here.
Zacks Investment Research
The views and opinions expressed herein are the views and opinions of the author and do not necessarily reflect those of Nasdaq, Inc.
5 Stocks Our Experts Predict Could Double In the Next Year
By submitting your email, you'll also get a free pivot & flow membership. A free daily market overview. You can unsubscribe at any time.