

Analysts Raise Concerns Over SoFi Technologies’ High Valuation Amid Market Fluctuations
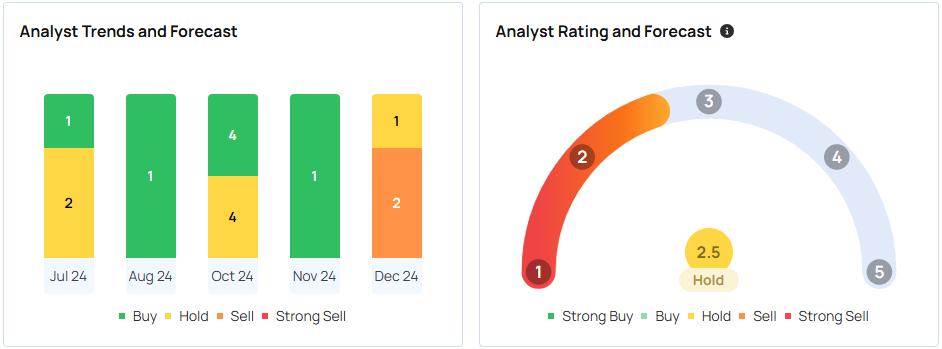
Overview of Recent Developments: SoFi Technologies SOFI has seen its stock downgraded by analysts who worry about its steep valuation. However, some technical indicators suggest the stock might find support soon.
Details of the Downgrade: Keefe, Bruyette, and Woods (KBW) recently downgraded SoFi to ‘underperform.’ This comes despite the stock rallying due to investor excitement and declining interest rates. Although KBW raised its price target slightly, they remain skeptical about SoFi’s high valuation compared to its long-term earnings potential, stating that it may not justify its current stock price.
In their analysis, the brokerage highlighted the significant challenges SoFi faces in meeting ambitious earnings goals. They believe that achieving necessary revenue growth and improving profit margins is critical. KBW concluded that the risk versus reward for investors currently leans towards possible losses.
According to Benzinga Pro, SoFi stock was calculated to be nearly three times more expensive than its competitors. SoFi’s forward price-to-earnings (P/E) ratio was 76.923, while its industry’s average stood at 26.384.
| Stocks | Market Cap | Forward P/E |
| American Express AXP | 209.453B | 19.531 |
| Capital One Financial COF | 67.880B | 11.696 |
| Discover Financial DFS | 43.322B | 14.065 |
| Synchrony Financial SYF | 25.327B | 9.709 |
| SoFi Technologies SOFI | 16.711B | 76.923 |
| Average: 26.3848 |
Context and Implications: In December, Bank of America Securities also downgraded SoFi, citing concerns of overvaluation with the stock trading at a significant premium compared to similar companies in the sector.
In contrast, Jefferies upgraded its rating on SoFi to “Buy” and raised its price target, showing a more positive outlook for the company’s future.
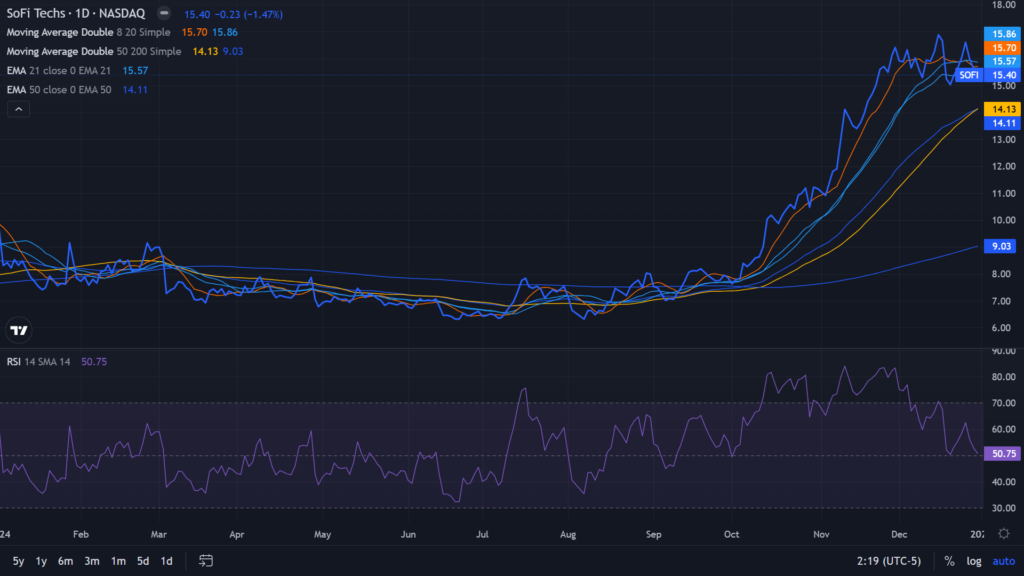
On the technical side, daily moving averages indicate a strong support level for SoFi’s stock. Recently, shares closed at $15.40, above both the 50-day and 200-day simple moving averages, which points to a generally positive trend. The 20-day moving average stands at $15.86.
These averages help gauge stock performance over time, with the longer averages (50 and 200 days) providing insights into long-term trends, while the eight and 20-day averages reflect shorter periods.
The relative strength index (RSI) of 50.75 indicates that the stock is currently in neutral territory.
Final Observations on Price Movement: In 2024, SoFi’s shares surged by 59.59%, outperforming the Invesco QQQ Trust ETF QQQ, which had a gain of just 26.99%, according to data from Benzinga Pro.
Benzinga reports that analysts have a consensus price target of $9.98 per share for SoFi, based on evaluations from 26 analysts. The highest target price, at $16 per share, comes from JPMorgan as of December 2, 2024, while the lowest target is $3 per share from Wedbush given on April 30, 2024.
The average price target among Morgan Stanley, Bank of America Securities, and JPMorgan indicates a potential downside of 11.14%, averaging at $13.67 per share.
Additional Insights:
Photo courtesy: Shutterstock
Market News and Data brought to you by Benzinga APIs


