

SoFi Technologies Soars After Major Loan Deal SOFI has jumped by 9% to $9.80 by 11 AM ET on Oct. 14.
This rise comes on the heels of a new $2 billion loan agreement with Fortress Investment Group, aimed at enhancing its loan platform business.
With a year-to-date increase of 2.23% and a notable 19.58% rise over the last year, SoFi is generating significant attention. Recent positive developments and economic trends have led SoFi stock to achieve a Golden Cross pattern.
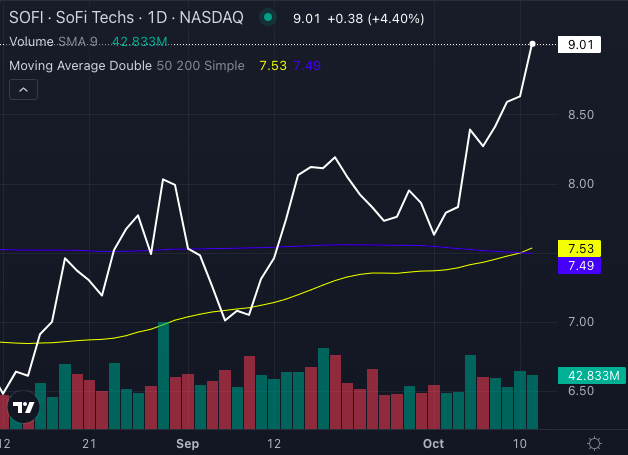
Chart created using Benzinga Pro
Expanding Horizons with Fortress Investment
CEO Anthony Noto emphasized the significance of this partnership: “SoFi’s loan platform business is crucial to our strategy. This collaboration not only enhances our capacity but also diversifies our revenue streams.”
The alliance with Fortress positions SoFi to improve its loan products and secure a stronger presence in the bustling fintech sector.
Launch of New Credit Cards Amid Positive Market Trends
SoFi’s momentum continues with the introduction of two new credit cards: the SoFi Everyday Cash Rewards Credit Card, which offers 3% cash back on dining, and the SoFi Essential Credit Card, aimed at individuals looking to build their credit with no annual fees.
This timely expansion of financial products coincides with favorable economic indicators and a recent 50 basis point rate reduction by the Federal Reserve, likely drawing more borrowers to SoFi’s offerings.
Read Also: 4 Stocks Set to Benefit from Recent Interest Rate Cuts
Earnings Report on the Horizon
Mark your calendars: SoFi plans to release its third quarter earnings report on Oct. 29. Analysts expect earnings of 4 cents per share and quarterly revenue of $629.2 million, increasing anticipation around SoFi’s future performance.
Strong Indicators Support Bullish Outlook
From a technical perspective, SoFi’s recent Golden Cross—a bullish sign indicating that the short-term moving average has crossed above the long-term moving average—has attracted traders’ interest. The stock is currently trading above its five, 20, and 50-day exponential moving averages, indicating robust buying activity.
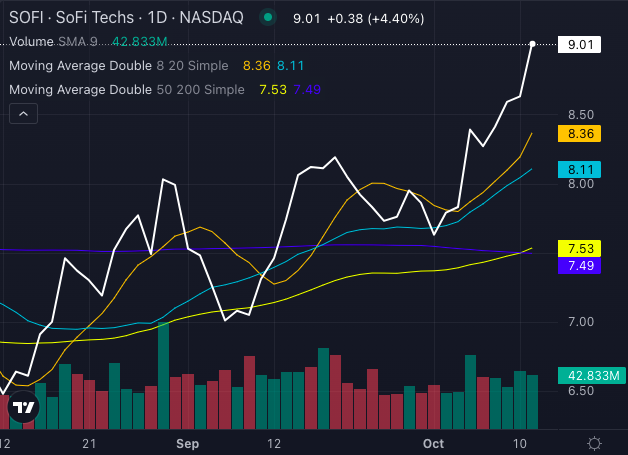
Chart created using Benzinga Pro
With a share price of $9.01 surpassing its eight-day simple moving average of $8.36, 20-day SMA of $8.11, 50-day SMA of $7.53, and 200-day SMA of $7.49, these indicators favor continued upward momentum.
As SoFi continues to innovate and broaden its product range, supportive market conditions and strong technical signals may lead to further gains. Investors are closely monitoring this fintech player as it strives for success.
Read Next:
Image: Shutterstock
Market News and Data brought to you by Benzinga APIs


