Market Volatility: Investment Insights Amidst a Bumpy Ride
Over the past century, no asset class has rivaled the annualized returns of stocks. However, navigating Wall Street can be challenging, as illustrated by recent market fluctuations.
On February 19, the S&P 500 (SNPINDEX: ^GSPC) reached an all-time closing high. Since then, both the Dow Jones Industrial Average (DJINDICES: ^DJI) and S&P 500 have entered correction territory, while the growth-friendly Nasdaq Composite (NASDAQINDEX: ^IXIC) has plunged into a bear market.
Market corrections are a common occurrence, but April has been notable for the rapid swings observed in the major indices. On April 9, the Dow, the S&P 500, and the Nasdaq Composite each recorded their largest single-day point gains in history. However, the S&P 500 also experienced a significant 10.5% drop over two days from April 2 to April 4, marking its fifth-worst two-day decline in the last 75 years.
Image source: Getty Images.
Such dramatic fluctuations are rare and often present unique investment opportunities. Although the causes of this volatility are expected to persist, the S&P 500 recently achieved a rare milestone that may provide investors with optimism.
Market Challenges Ahead
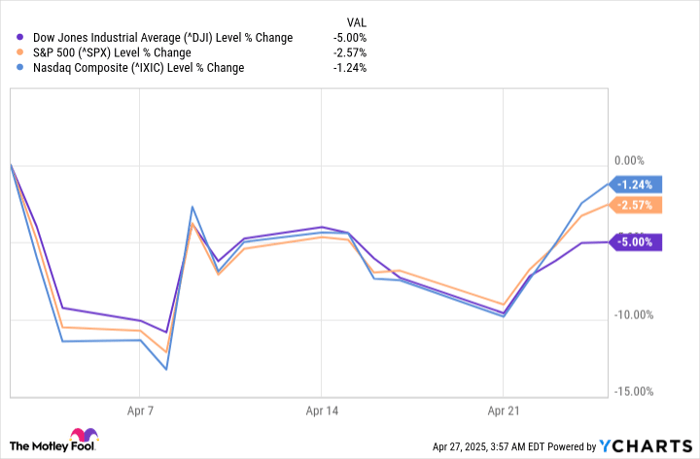
Market corrections, bear markets, and crashes rarely stem from a singular issue. Currently, several challenges are impacting Wall Street’s performance, with President Trump’s tariff policy as the main focus. Approximately four weeks ago, Trump announced a 10% global tariff targeting specific countries with trade deficits with the U.S. On April 9, he placed a 90-day pause on reciprocal tariffs for all countries except China, the same day major market rallies began.

Performance of Wall Street’s major stock indexes since Trump’s tariff announcement. ^DJI data by YCharts.
While tariffs can generate additional revenue for the U.S. and make American goods more competitive, they could also strain trade relations with allies. Retaliation through tariffs could raise prices for American products in foreign markets.
Additionally, Trump’s tariff strategy could contribute to inflation. Tariffs on imported goods used in U.S. manufacturing may lead to increased production costs, rendering those goods less competitive.
This uncertainty arrives as the Atlanta Federal Reserve’s GDPNow model forecasts a sharp decline in U.S. GDP, the most significant drop outside of the COVID-19 pandemic era since the Great Recession. If the GDPNow estimate holds and shows a 2.5% contraction in first-quarter GDP, corporate earnings growth may naturally slow or decline.
Other headwinds facing the market include the S&P 500’s relatively high valuation and increasing Treasury bond yields, potentially elevating borrowing costs.
Image source: Getty Images.
Positive Signals for the S&P 500
Heightened volatility often encourages investors to seek historical correlation data to anticipate future market moves. While no method guarantees outcomes, some indicators have strong track records in forecasting stock returns.
On April 22-24, the S&P 500 experienced a rare occurrence, finishing up by 2.51%, 1.67%, and 2.03%, respectively. This marked the 11th time since 1950 that the index gained at least 1.5% for three consecutive trading days.
As noted by Ryan Detrick, Chief Market Strategist at Carson Group, these instances of substantial gains are historically predictors of robust market performance in the following year.
The S&P 500 is up at least 1.5% for three days in a row.
This isn’t typical for bear market rallies. It precedes periods of strong performance.
Higher 10 out of 10 times a year later and up 21.6% on average. pic.twitter.com/kfvfNKq6IK
— Ryan Detrick, CMT (@RyanDetrick) April 25, 2025
In the 10 previous occurrences where the S&P 500 logged gains of at least 1.5% over three consecutive sessions, the index saw a positive return in the following year 100% of the time. Moreover, these stretches of optimism often resulted in substantial average gains.
Historical Insights: S&P 500 Shows Strong Returns After Market Fears
The one-year return for the S&P 500 following significant market downturns stands at 21.6%, significantly higher than its average annual return of 9.2% since 1950. This trend highlights a pattern where periods of market fear often precede strong recoveries.
Although downturns in the Dow Jones Industrial Average, S&P 500, and Nasdaq Composite can be unsettling for investors, historical data shows that some of the best returns occur shortly after these moments of uncertainty. Events such as the COVID-19 crash in 2020, the anti-austerity movements in 2011, the dot-com bubble burst in 2002, the Black Monday crash of 1987, and the oil embargo of 1974 illustrate this phenomenon.
Typically, when Wall Street appears most dire, investment opportunities often shine brightest. While tariffs and trade uncertainties remain unresolved, history supports the idea that short-lived fears can lead to significant market opportunities.
Is Now the Right Time to Invest $1,000 in the S&P 500?
Before purchasing shares in the S&P 500 Index, consider the following:
The analyst team at Motley Fool recently identified their top 10 stock picks for investors, notably excluding the S&P 500 Index. The selected stocks are projected to yield substantial returns in the upcoming years.
For instance, consider when Netflix was recommended on December 17, 2004. Had you invested $1,000 at that time, it would be worth approximately $607,048 today!* Similarly, Nvidia was highlighted on April 15, 2005, and a $1,000 investment would now be valued at around $668,193!*
It’s essential to note that Stock Advisor boasts an impressive total average return of 880%, significantly outperforming the S&P 500’s 161% over the same period. Don’t miss the latest top 10 stock list available through Stock Advisor.
Sean Williams has no position in any of the stocks mentioned. The Motley Fool has no position in any of the stocks mentioned. The Motley Fool follows a disclosure policy.
The views and opinions expressed herein are those of the author and do not necessarily reflect those of Nasdaq, Inc.