Volatile Market Trends: Are Investors Prepared for What’s Next?
The stock market can be a powerful wealth creator over time, but it often presents short-term challenges for investors. Recently, on February 19, the benchmark S&P 500 (SNPINDEX: ^GSPC) closed at an all-time high of 6,144. However, just two months later, the S&P 500 and the Dow Jones Industrial Average (DJINDICES: ^DJI) both fell into correction territory, while the growth-oriented Nasdaq Composite (NASDAQINDEX: ^IXIC) even entered a bear market for the first time since 2022.
Beyond the declines, the speed of recent market movements has drawn attention. In April, the Dow Jones, S&P 500, and Nasdaq Composite recorded their largest single-day point gains ever on April 9, following the S&P 500’s fifth-worst two-day percentage decline of -10.5% in the last 75 years.

Image source: Getty Images.
Market volatility often leads investors to analyze historical trends for insights on future performance. While no tool can predict market movements with certainty, specific events have shown strong correlations with market shifts. Recently, the S&P 500 reached a significant milestone, maintaining a perfect forecasting record over the past 75 years.
Causes of Recent Stock Market Volatility
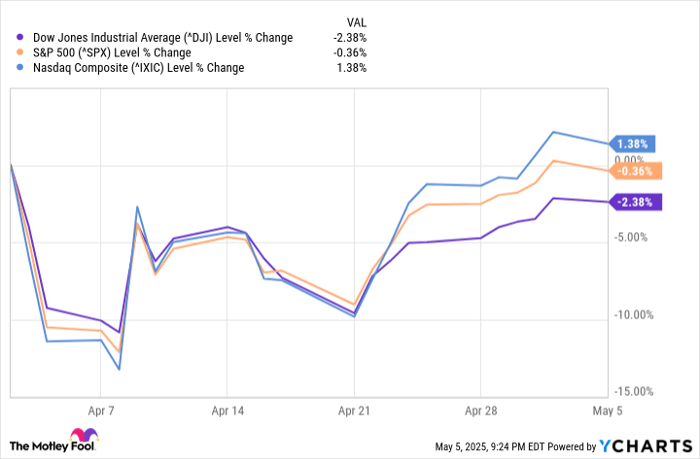
To understand the milestone achieved by the S&P 500, it’s crucial to explore the factors that have driven volatility in the major indexes since April. The uncertainty largely stems from President Donald Trump’s tariff announcement on April 2, which introduced a 10% global tariff and higher reciprocal tariffs on numerous countries that historically trade at a deficit with the U.S. Following this, a 90-day pause on these tariffs (excluding China) was announced, resulting in those extraordinary single-day gains.

Markets reacted sharply to Trump’s tariff announcement. ^DJI data by YCharts. Return data spans April 2, 2025 – May 5, 2025.
Trump views tariffs simply as a means to generate revenue, protect American jobs, and encourage domestic manufacturing. However, the real implications are complex. His approach generally fails to distinguish between input and output tariffs, raising concerns that higher costs for materials might render U.S.-made products less competitive against imports.
Additionally, the shifting nature of products subjected to tariffs has fueled investor uncertainty. Clarity is what the market craves, yet this has been lacking.
Other factors influencing Wall Street include historically high stock valuations, a slight 0.3% decline in Q1 gross domestic product, and rising Treasury bond yields, which can increase borrowing costs for consumers and businesses.

Image source: Getty Images.
Positive Indicators Amidst Market Turbulence
After examining the causes of market volatility, it’s time to focus on the milestone reached by the S&P 500—occurring for only the 17th time since 1950. Although the recent market dynamics have included a nine-day winning streak for the S&P 500, that alone isn’t the milestone in question.
Last week, the S&P 500 bounced back by recovering half of its earlier decline of 18.9% from February 19 to April 8. This is notable as it’s the 17th instance of the S&P 500 entering either a bear or near-bear market and subsequently recovering at least half of those losses.
More good news?
Half of the 2025 near bear market has been recovered.
Only once in history were new lows made (last time in 2022), but a year later, it has never been lower, up 16 out of 16 times.
More clues, when stacked on top of other clues, the lows are likely in for ’25.
While the S&P 500’s performance one month post-recovery has been varied, history shows positive trends 12 months later. Specifically, in 16 out of 16 occasions, the S&P 500 ended higher.
Although the index has seen small gains occasionally after reaching a 50% recovery from a bear market, typically, a climb follows such recoveries. Market participants should monitor these indicators closely.
# Average Gains Post-Bear Market Hint at Positive S&P 500 Trends
Data indicates that the average gain 12 months following certain market occurrences is 18.3%. This figure is effectively double the average annual return of 9.2% for the S&P 500 since 1950, according to Ryan Detrick. In essence, this event generally signals a period of significant gains for this widely tracked index.
Moreover, Detrick’s dataset highlights that the S&P 500 has only once (in 2022) experienced a recovery of at least 50% from a bear market or near-bear low, only to drop to a new low afterward. This implies that historically, a 50% recovery has indicated that the market low is achieved 94% of the time over the last 75 years.
The data from Detrick underscores the non-linear nature of the investment cycle. While market corrections, bear markets, and crashes are common, these downturns are typically fleeting.
In June 2023, analysts at Bespoke Investment Group released data comparing the duration of every S&P 500 bull and bear market since the Great Depression began in September 1929. Their findings reveal that the average S&P 500 bear market lasts just 286 days, while a typical bull market spans approximately 1,011 days—about 3.5 times longer.
Thus, when considering the long-term outlook, maintaining an optimistic perspective often pays off.
Should You Invest $1,000 in the S&P 500 Index Now?
Before making an investment in the S&P 500 Index, here are some factors to keep in mind:
The analyst team at Motley Fool Stock Advisor has recently identified the 10 best stocks for current investment opportunities, with the S&P 500 Index not appearing in this selection. The stocks that have been highlighted may yield substantial returns in the coming years.
For example, when Netflix was recommended on December 17, 2004, a $1,000 investment at that time would now be worth $613,546. Similarly, Nvidia was suggested on April 15, 2005, and a $1,000 investment then would be worth $695,897 today.
It’s noteworthy that Motley Fool Stock Advisor boasts a total average return of 893%, which surpasses the 162% return of the S&P 500. This performance underscores the potential value of exploring new investment opportunities.
Sean Williams has no position in any of the stocks mentioned. The Motley Fool has no position in any of these stocks. The Motley Fool has a disclosure policy.
The views expressed in this article are those of the author and do not necessarily reflect the views of Nasdaq, Inc.