
Investors who heeded my “hold” rating on the SPDR S&P 500 Trust ETF (NYSEARCA:SPY) in my previous piece, “SPY: An Early Contrarian Opportunity,” published on October 10, 2023, have seen substantial positive momentum, showcased by a robust trailing support and relative strength. Capitalizing on SPY’s brief dip below the trendline, investors anticipated a 10% return with low risk. However, the current situation is more nuanced, with SPY now encountering formidable resistance that could trigger either substantial upside potential or a significant downturn. In this piece, I will evaluate the present state of critical market indicators related to SPY, emphasizing a contingency plan that takes into account plausible outcomes and effective risk management in this uncertain market environment.
Assessing Market Breadth and Trends
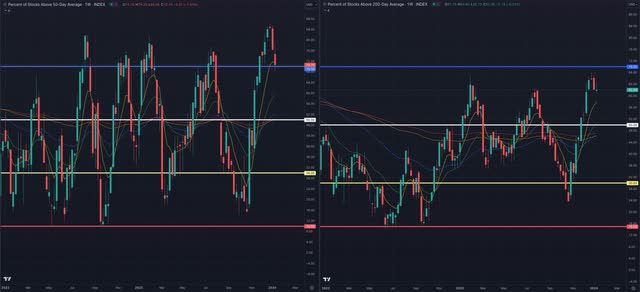
The Market Breadth, as measured by the MMFI and represented as the percentage of stocks trading above their 50-day moving averages [MAV], has witnessed a significant upsurge, surpassing 86%. This marks its highest level since February 2021, just before descending until May 2022. Despite the benchmark retracing since the close of 2023, the reading remains above the 70% threshold, indicating widespread market participation. Spikes above this level could be interpreted as contrarian entry signals, signaling potential exhaustion among buyers.
Turning attention to the MMTH, approximately 62% of stocks have exceeded their 200-day MAV, surpassing the peak during the last robust market run observed in February 2023. Historically, levels around 70% have been associated with potential market reversals, while exceptionally strong uptrends, as seen in 2020, 2009, or 2004, have resulted in readings exceeding 90%. Notably, both benchmarks have retraced subsequent to forming a rejection bar, suggesting a potential conclusion and reversal of the prevailing trend.
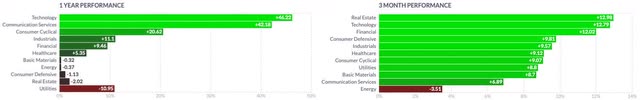
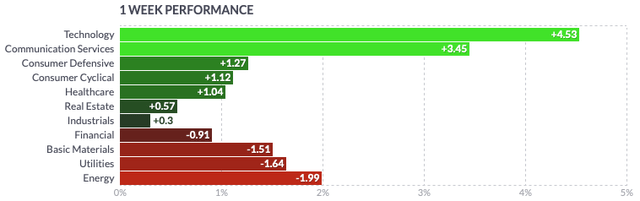
Over the last three months, nearly all sectors in the US economy demonstrated positive performance, with notable gains observed in the technology, real estate, and consumer cyclical sectors. The sole exception was the energy sector, which experienced a decrease. In recent weeks, certain sectors displayed signs of relative weakness, though it remains premature to draw conclusions indicating a broader turnaround based on this observation.
The overall surge in recent months has been remarkable, reflecting the economy’s resilience. Inflation exhibited a sequential softening trend until a slight increase in the December 2023 reading. The impact of higher interest rates on financial conditions is substantial, though many industries have not yet reached a point causing a significant cooldown, mirroring the resilience seen in the labor market. Nevertheless, there has been a decline in personal consumption spending in the past quarter, hinting at a potential escalation in the erosion of domestic purchasing power.
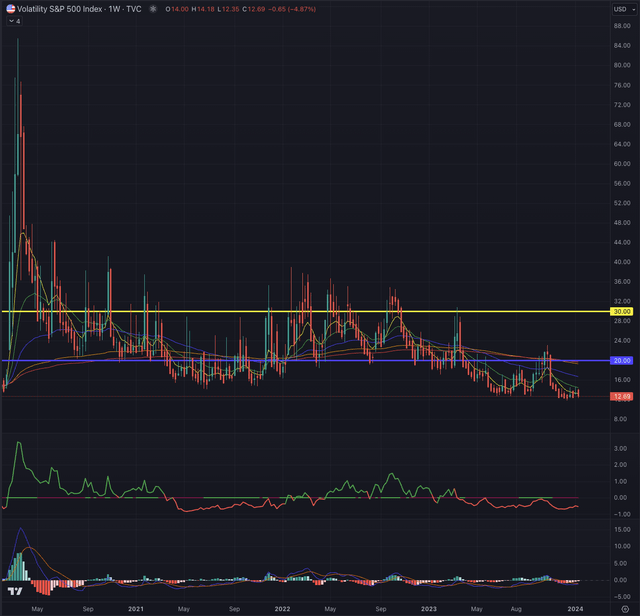
The CBOE Volatility Index (VIX) tends to be moderate during bull markets and higher in bear markets. Spikes in the VIX are often observed during periods of extreme uncertainty or unexpected major events, typically viewed as negative catalysts for the stock market. On December 12, 2023, the indicator hit a low of 11.81, a level not seen since November 2019. Since then, it has experienced two spikes above 14 before retracing back to its current level. While the historically low VIX level may suggest an opportunity for an early contrarian strategy, investors should be cautious, considering the possibility that the VIX could remain at these levels for some time before surging above the threshold of 20, indicating a moderately volatile market. Breaking through strong overhead resistance and the trailing EMAs would require the VIX to build significant positive momentum.
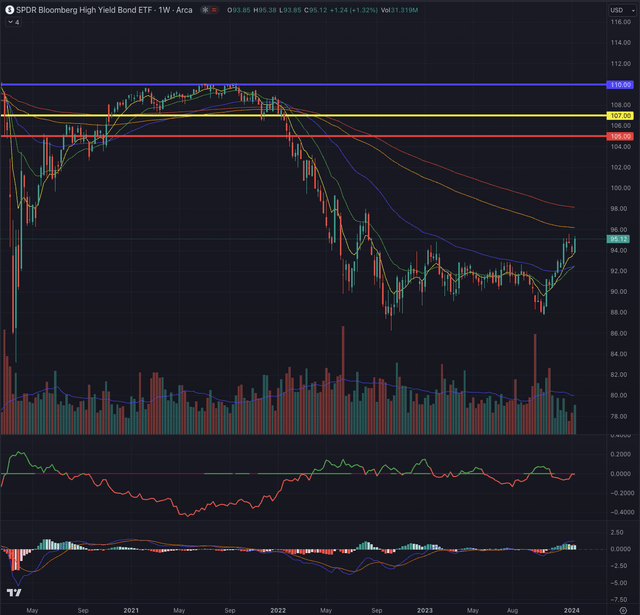
The SPDR Bloomberg Barclays High-Yield Bond ETF (JNK), which monitors highly liquid, high-yield, US dollar-denominated corporate bonds, has emerged from an extended downturn. This breakthrough has propelled the benchmark 10% higher from its October 2022 low towards its EMA144, backed by a sharply rising EMA8. Additionally, the EMA21 is on the verge of a bullish crossover with EMA55. Despite this positive rebound, JNK is still notably undervalued compared to its pre-pandemic levels. This reflects investors’ relatively cautious risk appetite in a high-interest-rate environment, where low-risk bonds and other assets offer attractive returns.
With bullish momentum indicated by the MACD and a progressively diminishing relative weakness, JNK appears poised for further upside potential. Investors may want to monitor the benchmark closely as it approaches its EMA200, a crucial resistance area that is likely to shape its mid-term direction.
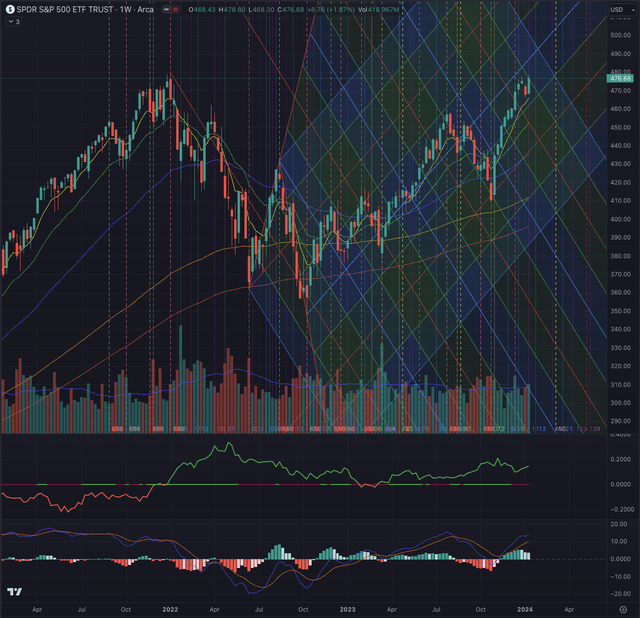
On the weekly chart, momentum remains strong, with EMA8 as trailing support, while significant relative strength is building up. Investors who took note of my “hold” rating on October 10, 2023, and possibly even augmented their positions by the end of October, benefited from substantial positive momentum in SPY. This was evident through a pronounced MACD crossover and essential relative strength compared to the broader small-cap market monitored by the iShares Russell 2000.
Assessing the Current State of the SPY Fund and Predicting its Future Movement
The Current Landscape
The exchange-traded fund (ETF) SPY has garnered significant attention in recent market movements. Amidst the flux of bullish momentum, investors have honed in on SPY with the potential for a substantial 10% return coupled with comparably lower risks. As SPY made a notable dip below the trendline before promptly reverting, the scenario unfolded precisely as anticipated.
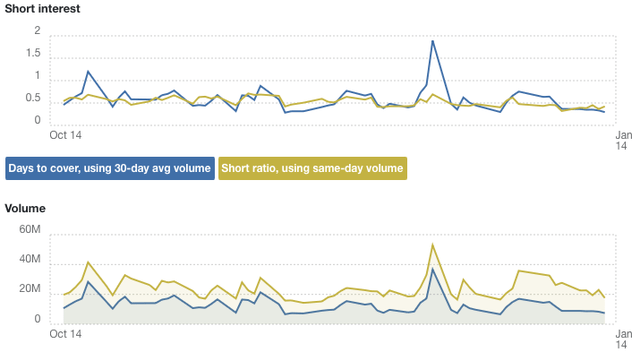
Analysis of SPY’s short interest over the past three months reveals a slight downward trend, with occasional spikes in short exposure, culminating in no substantial overall change. Conversely, SPY fund flows display a significant net inflow of $43.92B during the same period, sharply contrasting the outflow recorded in the preceding three months. This trend reflects the strong interest of market participants in capitalizing on the potential stronger momentum of the current bull market.
Factors Influencing the Future
As SPY strives to attain the $479.98 pinnacle, a potential breakout would mark a new all-time high (ATH) while also posing the risk of forming a double top, potentially driving the index back toward its nearest support area at $459. The market’s pervasive optimism, predicated on the anticipation of six rate cuts throughout 2024, reveals an abundance of positivity that may, in turn, yield substantial downside potential should the actual economic climate diverge from current expectations.

Delving into the daily chart illuminates an even more pronounced bullish trajectory, with short-term Exponential Moving Averages (EMAs) serving as firm trailing supports while SPY breaches prior resistance zones on its way to the ATH. An assessment of the potential buildup of a more positive momentum, as indicated by the Moving Average Convergence Divergence (MACD) and the relative strength concerning the IWM, suggests an early upturn. Concurrently, diminishing volume serves as an additional indicator, hinting at a significant impending movement.
Anticipated Scenarios
Approaching the ATH, SPY encounters the likelihood of testing the resistance level before achieving a breakthrough. This situation is underscored by the presence of substantial pending short orders at the resistance level, representing a potential hurdle for bullish advances, particularly in light of some market participants seeking to profit from the robust ascent of recent months.
Conversely, in the event of a breakout, initial targets of $490.50 and subsequently $500 come into focus. Notably, in the scenario of a rejection, SPY may test the support below before embarking on a second surge, replete with amplified bullish momentum. A breakdown culminating in a failed low at the support level would likely direct SPY toward $450 before testing its EMA200, shedding light on its ensuing trajectory.
Caution is advised for investors, as a spurious breakout could ensnare long positions above the ATH, where a surplus of bulls anticipates further upside before SPY regresses, trapping unwary investors above the resistance.
Guidance and Recommendations
In navigating this landscape, it is prudent to refrain from shorting the index at present. However, should the price descend below EMA21 and particularly breach the aforementioned support region, a carefully measured entry into short positions merits consideration. Concomitantly, the present juncture, characterized by substantial uncertainty surrounding the ATH, advises against entering long positions, particularly for those who secured their positions at significantly lower price levels. Lastly, a maintenance of the hold rating on SPY is advised, though investors who entered at markedly lower levels may contemplate partial divestment to crystallize profits, while awaiting improved entry opportunities in the future.
The Significance of Technical Analysis
Technical analysis constitutes an invaluable instrument, bolstering the likelihood of investors’ success without guaranteeing absolute certainty. Analogous to consulting a map or availing of GPS for an unfamiliar journey, the integration of technical analysis in investment decisions equates to a strategic guide. Drawing upon techniques derived from the Elliott Wave Theory and leveraging Fibonacci’s principles, the analysis informs likely outcomes contingent upon probabilities, thereby affirming or refuting potential entry points based on factors such as sector, industry, and most notably, price action. This semblance of technical analysis serves to scrutinize an asset’s posture and determine potential outcomes rooted in the aforementioned theories.
Notably, this article intentionally focuses on pivotal indicators germane to assessing the status of significant indexes within the US financial markets, purposefully omitting a macroeconomic analysis in favor of concentrating on SPY, despite the potential relevance of alternative economic indicators from a divergent perspective.
Conclusive Outlook
With SPY’s aspiration for an ATH incursion at $479.98 and the concomitant prospect of a double top formation, market observers must remain attuned to potential support at $459. The sanguine market sentiment, anchored in the anticipation of six anticipated rate cuts in 2024, may confront downside risks precipitated by shifts in the economic climate. The robust uptrend evident in the daily chart, fortified by the anchorage of short-term EMAs, underscores the potential for early upward momentum, as evidenced through indicators such as the MACD and relative strength. However, the approach to the ATH portends a definitive resistance test. Thus, a hold rating on SPY is advocated, with investors who entered at lower levels urged to contemplate partial divestment while awaiting opportune entry points.