
Starbucks Reports Mixed Q2 Results with Slowing Sales Growth
Starbucks Corporation (SBUX) announced its second-quarter fiscal 2025 results, revealing that both earnings and net revenues fell short of the Zacks Consensus Estimate. While year-over-year revenue increased, the company’s bottom line showed a significant decline compared to the previous year.
Following these results, SBUX stock dropped 6.4% during Tuesday’s after-hours trading. Investor sentiment soured as the company underperformed in earnings, attributing this to rising operational costs and increased investment in store upgrades.
Management recognized that the recent results did not reflect the company’s true potential. However, they emphasized ongoing foundational progress across all four pillars of their turnaround strategy—partners, coffeehouse experience, customer engagement, and marketing/menu innovation. This approach is intended to enhance Starbucks’ ability to test, iterate, and efficiently scale new initiatives, which will support long-term sustainable growth and robust returns on invested capital.
Q2 Earnings, Revenue & Comparable Sales Insights
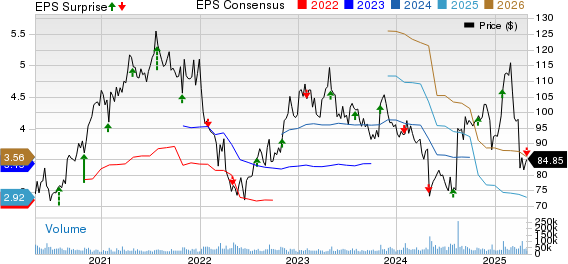
In the second quarter, Starbucks reported earnings per share (EPS) of 41 cents, missing the Zacks Consensus Estimate of 49 cents by 16.3%. This figure marked a notable year-over-year decline of 39.7% from the 68 cents reported in the same quarter last year.
Starbucks Corporation Price, Consensus and EPS Surprise

Starbucks’ net revenues totaled $8.76 billion, slightly below the consensus expectation of $8.79 billion, reflecting a 0.3% shortfall. However, this was a 2.3% increase from $8.56 billion reported the previous year.
Global comparable store sales dropped 1% year over year, driven by a 2% decline in comparable transactions, which was partially offset by a 1% rise in average ticket size.
During the quarter, Starbucks opened 213 new stores globally, bringing its total to 40,789 at the end of the quarter.
Declining Margin Performance in Q2
The company’s Non-GAAP operating margin decreased 460 basis points (bps) to 8.2% year over year. This decline was largely attributed to expense deleverage and increased labor costs associated with the “Back to Starbucks” initiative. Furthermore, restructuring costs related to streamlining its global support organization added to the margin pressures.
On a constant currency (cc) basis, the Non-GAAP operating margin shrank 450 bps compared to the previous year.
Segment Performance Overview
Starbucks operates in three segments: North America, International, and Channel Development.
North America: This segment generated net revenues of $6.47 billion, a 1% increase year over year. Comparable store sales decreased 1%, compared to a 3% drop reported in the prior-year quarter. Average transactions fell by 4%, offset by a 3% rise in ticket size.
The operating margin in North America dropped 640 bps to 11.6%, compared to the prior-year quarter’s 18%. Analysts had predicted an operating margin of 13.4% for this segment.
International: This segment reported net revenues of $1.87 billion, a 6% increase year over year. Comparable store sales rose by 2%, in contrast to a 6% decline in the same quarter last year. Average transactions increased by 3%, while ticket size fell by 1% year over year.
Operating margin in the International segment contracted 170 bps to 11.6%. Increased promotional activities and restructuring costs impacted this metric, though some benefits from leverage were also observed. Analysts had expected a margin of 10% for this segment.
For the fiscal second quarter, comparable sales in China were flat, compared to an 11% decline a year earlier. Transactions increased by 4%, although average ticket sizes fell by 4%.
Channel Development: This segment’s net revenues declined by 2% year over year to $409 million, primarily due to reduced contributions from the Global Coffee Alliance.
Operating margin in Channel Development decreased by 440 bps to 47.3%. This decline was driven by higher product costs related to the Global Coffee Alliance and a dip in income from the North American Coffee Partnership joint venture. Analysts had anticipated an operating margin of 40% for this segment.
Financial Position Summary
At the end of the fiscal second quarter, Starbucks reported cash and cash equivalents of $2.67 billion, down from $3.29 billion at the end of fiscal 2024. Long-term debt stood at $13.3 billion, compared to $14.3 billion as of September 29, 2024. The current portion of this debt was $2.25 billion, up from $1.25 billion at the end of fiscal 2024.
Additionally, management declared a quarterly cash dividend of 61 cents per share, payable on May 30, 2025, to shareholders of record as of May 16.
Starbucks’ Investment Rating
Currently, Starbucks holds a Zacks Rank #3 (Hold).
Updates from the Retail and Wholesale Sector
Fastenal Company (FAST) reported adjusted earnings for the first quarter of 2025 that met the Zacks Consensus Estimate, with net sales surpassing expectations and showing year-over-year growth. Sales growth was driven by enhanced customer contract signings, although it was offset by sluggish business activity. Earnings were impacted by rising fleet and transportation costs alongside increased labor expenses.
Chipotle Mexican Grill, Inc. (CMG) presented mixed first-quarter 2025 results; earnings exceeded the Zacks Consensus Estimate while revenues fell short. Both metrics showed year-over-year increases. Chipotle faced challenges such as unfavorable weather and reduced consumer spending. Despite this, the company has made significant enhancements in restaurant operations and expanded its brand presence both locally and globally.
Dave & Buster’s Entertainment, Inc. (PLAY) released fourth-quarter results that highlighted recent industry trends.
Dave & Buster’s Q4 Results Show Mixed Financial Indicators
In its fiscal 2024 results, Dave & Buster’s earnings exceeded the Zacks Consensus Estimate, while revenues fell short. Both earnings and revenues experienced a decline compared to the previous year.
Mixed Signals in Q4 Performance
While the fourth quarter reports were disappointing, the company remains optimistic about its direction. Recent trends indicate a potential turnaround, as the current leadership team is revising many of the strategies implemented by prior management. They are refocusing on a disciplined, fundamentals-driven approach in marketing, operations, and capital spending.
Understanding the Financial Landscape
Despite the challenges, the management team’s adjustments may signal a positive shift for investors. Maintaining a clear focus on core fundamentals is critical for the company as it seeks to regain its footing in a competitive market.
Overall, the mixed results from Dave & Buster’s reflect significant adjustments in strategy aimed at stabilizing and improving performance in the upcoming quarters.
This article originally published on Zacks Investment Research (zacks.com).
The views and opinions expressed herein are the views and opinions of the author and do not necessarily reflect those of Nasdaq, Inc.


