
AppLovin’s Earnings Report: Anticipations and Historical Performance Insights
AppLovin (NASDAQ:APP) will report its earnings on Wednesday, May 7, 2025. In the past five years, APP has shown a positive one-day return following its earnings releases in a notable 69% of cases. These gains have tended to be significant, marked by a median return of 24% and a peak of 46%. Such statistics underscore the high volatility often associated with APP stock around its earnings periods.
Strategies for Event-Driven Traders
For traders focused on event-driven strategies, understanding these historical patterns may offer a strategic edge. The market’s actual response, however, will largely depend on how the reported results align with consensus estimates and broader market expectations. Traders can consider two primary strategies:
- Pre-earnings Strategy: Evaluate the historical likelihood of a positive post-earnings return and take a position before the earnings announcement.
- Post-earnings Strategy: Investigate the historical connection between the immediate market reaction to earnings and medium-term returns, adjusting positions as needed after the earnings release.
Current Consensus Estimates
As of now, consensus estimates indicate that APP’s earnings per share will be $1.96, accompanied by sales projections of $1.38 billion. Last year, during the same reporting period, the company had earnings per share of $0.92 and sales of $1.06 billion.
Fundamental Overview
From a fundamental perspective, APP holds a market capitalization of $104 billion, with trailing twelve-month revenue of $4.7 billion. The company reports operational profitability, reflecting $1.9 billion in operating profits and a net income of $1.6 billion.
Historical Odds of Positive Returns Post-Earnings
Looking at the historical performance of one-day (1D) post-earnings returns:
- Over the last five years, there have been 16 earnings data points, resulting in 11 positive and 5 negative one-day returns, leading to a success rate of around 69% for positive returns.
- This percentage rises to 83% when analyzing the last three years.
- The median return for the 11 positive instances is 24%, while the median for the negative returns is -4.6%.
Additional statistics on 5-day and 21-day returns post-earnings are presented in the table below.
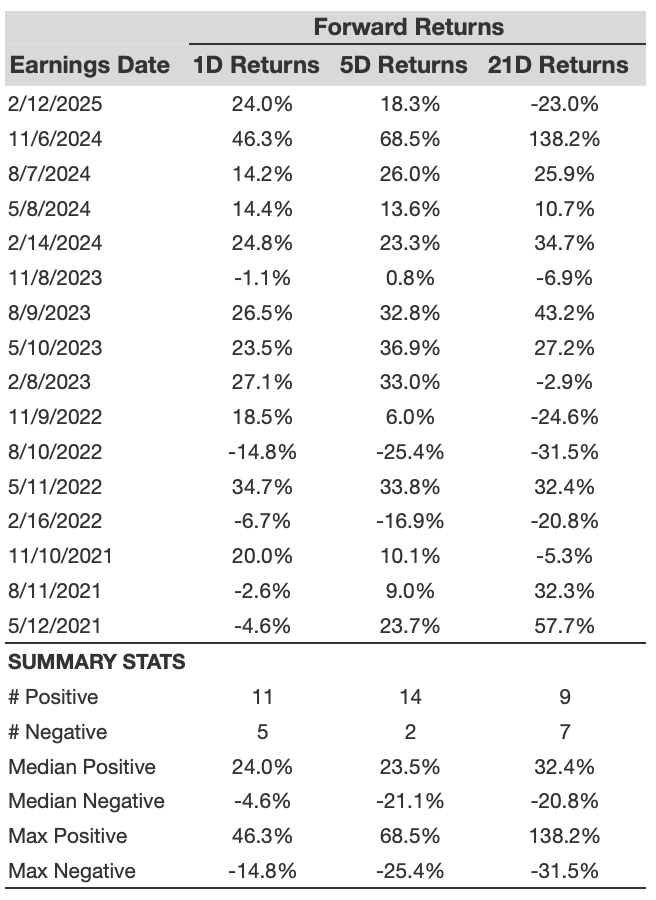
APP 1D, 5D, and 21D Post-earnings Return
Correlation Between Historical Returns
Understanding the relationship between short-term and medium-term returns post-earnings can provide insights for a relatively safer strategy. If a strong correlation exists between 1D and 5D returns, traders might consider going “long” after a positive 1D post-earnings return. Here is some correlation data based on both 5-year and 3-year histories. The term 1D_5D refers to the relationship between 1D post-earnings returns and the subsequent 5D returns.

APP Correlation Between 1D, 5D and 21D Historical Returns
Impact of Peer Earnings on Results
Peer performance can significantly influence post-earnings stock reactions. Often, market movements may start before the official earnings announcement. To provide a context, the following data illustrates AppLovin’s past post-earnings performance compared with peers that reported earnings just prior to it. The peer stock returns also represent post-earnings one-day (1D) returns.
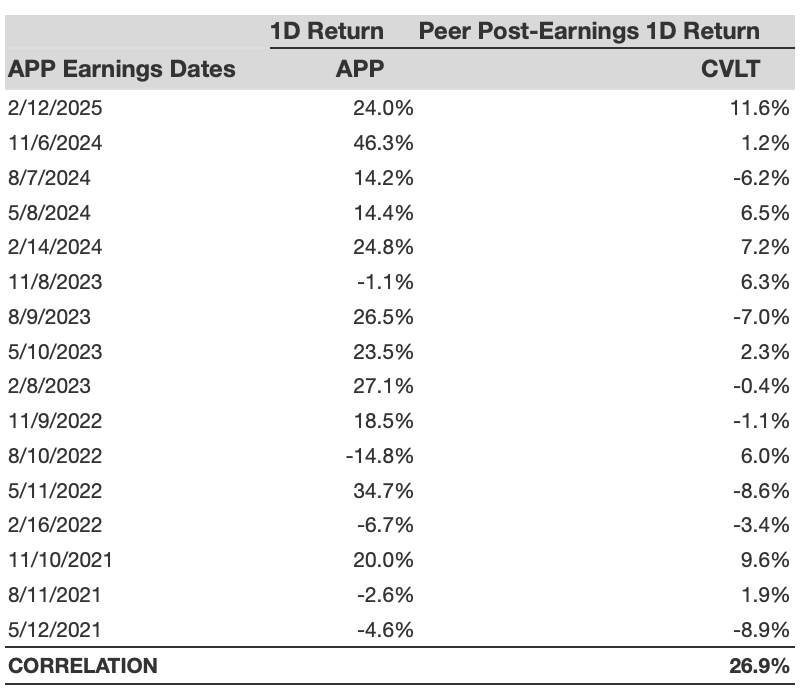
APP Correlation With Peer earnings
The views and opinions expressed herein are the views and opinions of the author and do not necessarily reflect those of Nasdaq, Inc.