
Sunrun Inc Shares Dip Below Key 200-Day Moving Average
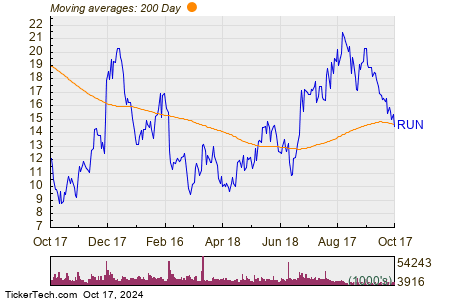
In a challenging trading session on Thursday, shares of Sunrun Inc (Symbol: RUN) fell below their crucial 200-day moving average of $14.71, hitting a low of $14.45 per share. Currently, the stock is down approximately 5.4% for the day. The chart below highlights the annual performance of RUN shares in relation to its 200-day moving average:

Analyzing the chart, it’s clear that the lowest price during the last 52 weeks for RUN shares was $8.4303, while the peak was $22.26. The most recent trade price stands at $14.57.
![]()
![]() Explore which other 9 stocks have recently dipped below their 200-day moving average »
Explore which other 9 stocks have recently dipped below their 200-day moving average »
Additional Insights:
- Airlines Dividend Stocks
- Funds Holding NYH
- 3M Average Annual Return
The views and opinions expressed herein are the views and opinions of the author and do not necessarily reflect those of Nasdaq, Inc.


