Target Corporation TGT came up with first-quarter fiscal 2024 results, wherein the top line marginally came ahead of the Zacks Consensus Estimate, while the bottom line missed the same. However, both the metrics declined year over year. Soft sales in discretionary categories hurt the company’s performance, with comparable sales continuing with its dismal run. However, strength was seen in the beauty category.
Despite challenges, Target is poised to capture market share over time, driven by its compelling value proposition and a spectrum of initiatives. These encompass the expansion of new stores, innovations in brands, the enhancement of same-day services and the rollout of the Target Circle loyalty program to drive traffic.
Sales & Earnings Picture
Target reported adjusted earnings of $2.03 per share, which missed the Zacks Consensus Estimate of $2.05. Markedly, the bottom line declined 1% year over year.
The big-box retailer generated total revenues of $24,531 million, which decreased 3.1% year over year. However, the metric marginally beat the Zacks Consensus Estimate of $24,517 million. We note that sales dropped 3.2% to $24,143 million, while other revenues jumped 3.9% to $388 million.
Meanwhile, comparable sales fell 3.7% in the first quarter, following a drop of 4.4% in the preceding quarter. The metric reflected a comparable store sales decline of 4.8%, offset by a comparable digital sales increase of 1.4%. We had expected a comparable sales drop of 3.6% and a comparable store sales decline of 3.4% for the quarter under discussion.
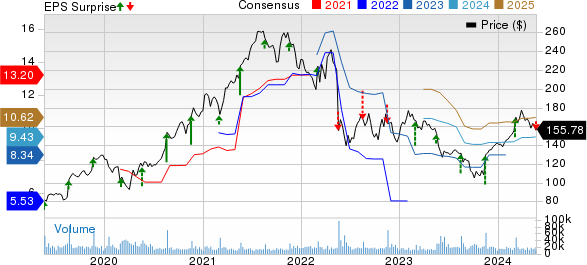
Target Corporation Price, Consensus and EPS Surprise
Target Corporation price-consensus-eps-surprise-chart | Target Corporation Quote
Margins
The gross margin expanded by 140 basis points to 27.7%, in line with our expectations. This can be attributed to effective merchandising strategies that included cost reductions outweighing the impact of higher promotional markdowns, as well as a favorable category mix. Concurrently, the operating margin rose to 5.3% from 5.2% in the corresponding period last year.
Other Financial Details
This Zacks Rank #3 (Hold) company ended the quarter with cash and cash equivalents of $3,604 million, long-term debt and other borrowings of $13,487 million and shareholders’ investment of $13,840 million. During the quarter, Target paid out dividends of $508 million.
Target did not buy back any shares during the quarter under review. At the end of the quarter, the company had about $9.7 billion remaining under the repurchase program approved in August 2021.
Outlook
Target anticipates comparable sales to be flat to up 2% in the second quarter of fiscal 2024. Both GAAP and adjusted earnings for the second quarter are expected to fall within the range of $1.95-$2.35 per share compared with $1.80 reported in the year-ago period.
For fiscal 2024, management continues to foresee a slight uptick in comparable sales, ranging from flat to 2%. GAAP EPS and adjusted earnings for the fiscal year are projected in the band of $8.60-$9.60 per share compared with $8.94 reported in fiscal 2023.
We note that shares of Target have risen 9.4% year to date compared with the industry’s growth of 11.4%.
Don’t Miss These Solid Bets
Sprouts Farmers Market SFM, which is engaged in the retailing of fresh, natural and organic food products, currently sports a Zacks Rank #1 (Strong Buy). SFM has a trailing four-quarter earnings surprise of 9.2%, on average. You can see the complete list of today’s Zacks #1 Rank stocks here.
The Zacks Consensus Estimate for Sprouts Farmers’ current financial-year sales and earnings suggests growth of around 8% and 9.5%, respectively, from the year-ago reported figure.
Casey’s General Stores CASY, the third largest convenience retailer and fifth largest pizza chain in the United States, currently carries a Zacks Rank #2 (Buy). CASY has a trailing four-quarter earnings surprise of 12%, on average.
The Zacks Consensus Estimate for Casey’s current financial-year earnings suggests growth of around 10.4% from the year-ago reported numbers.
Tractor Supply Company TSCO, the largest rural lifestyle retailer in the United States, currently carries a Zacks Rank #2. TSCO has a trailing four-quarter earnings surprise of 2.7%, on average.
The Zacks Consensus Estimate for Tractor Supply Company’s current financial-year sales and earnings suggests growth of around 3% and 2.4%, respectively, from the year-ago reported numbers.
Free – 5 Dividend Stocks to Fund Your Retirement
Zacks Investment Research has released a Special Report to help you prepare for retirement with 5 diverse stocks that pay whopping dividends. They cut across property management, upscale outlets, financial institutions, and a couple of strong energy producers.
5 Dividend Stocks to Include in Your Retirement Strategy is packed with unconventional wisdom and insights you won’t get from your neighborhood financial planner.
Download Now – Today It’s FREE >>
Target Corporation (TGT) : Free Stock Analysis Report
Tractor Supply Company (TSCO) : Free Stock Analysis Report
Casey’s General Stores, Inc. (CASY) : Free Stock Analysis Report
Sprouts Farmers Market, Inc. (SFM) : Free Stock Analysis Report
To read this article on Zacks.com click here.
The views and opinions expressed herein are the views and opinions of the author and do not necessarily reflect those of Nasdaq, Inc.


