This article dissects the potential impact of the upcoming FOMC January meeting and the potential rise in the Federal Funds Rate to 5.75% from the current 5.5%
The Trend in Federal Funds Rate
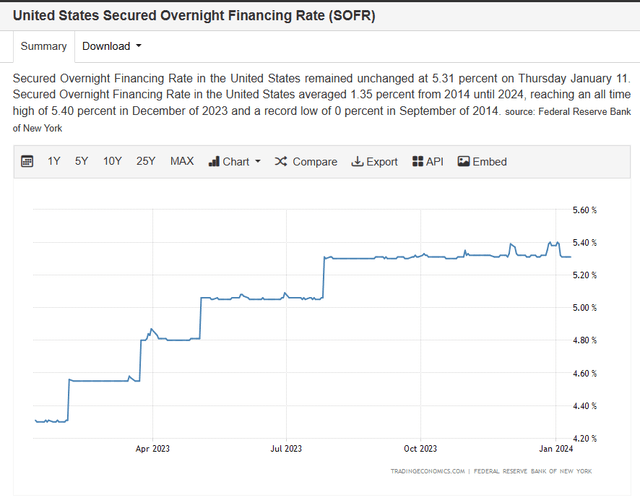
The Federal Reserve initiated a continuous series of rate hikes in March 2022, eventually reaching a 5.5% target range by August 2023. However, the pace of these hikes has decelerated, and the intervals between increases have lengthened. While a pause in rate hikes is likely, the prevailing bias leans towards a rate increase. Various factors contribute to this sentiment, such as disciplining federal government spending, promoting efficiency in the private sector, providing a buffer for the central bank to counter recessions, and fostering a culture of responsible saving.
Most likely, the new upper limit target range will be 5.75%, heralding adjustments to other rates, including the prime rate and Interest on Reserves Balances, while the process of Quantitative Tightening (QT) in bond selling will persist.
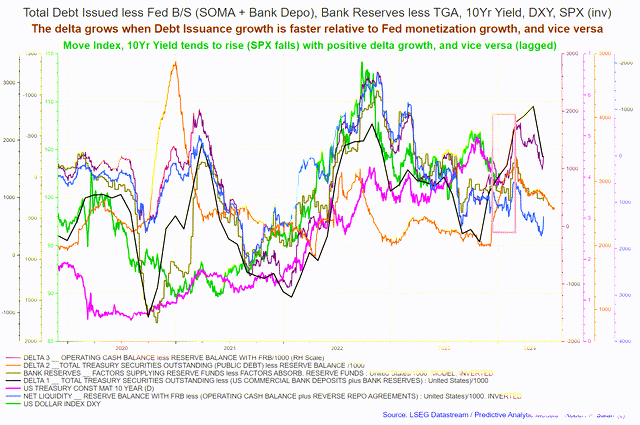
The chart below shows the relationship between various influencing factors and the Federal Funds Rate (FFR). It reflects how changes in these factors could lead the FFR to a downward trajectory.
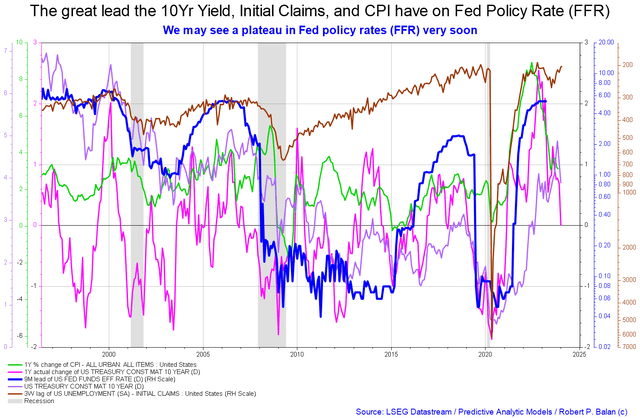
Historically, the Fed tends to persist with rate hikes until a crisis, at which point the rate is lowered in response. This recurring pattern underscores the perennial inclination towards upward rate adjustments.
Balance Sheet Dynamics and Yield Curve Control
The Fed’s balance sheet (SOMA) has been steadily diminishing due to its bond selling program. This reduction effectively transfers liquidity from the private sector to the government sector, consequently impacting the overall financial liquidity in the private sector. This reduction in private sector liquidity results from the abundance of Treasuries in the macroeconomy, which amplifies the longer end of the yield curve – effectively yielding a subtle form of yield curve control.
The impending movement of the Federal Funds Rate is poised to have significant ramifications, as it directly impacts the interest burdens on private debt, the interest on newly issued Treasury deposits, and the interest paid on reserve balances and repurchase (REPO) and reverse repurchase agreements (RREPO) balances.
The interbank rate chart offers a visual representation of the effectiveness of the Fed’s FFR maintenance endeavors, demonstrating that the rate is positioned at the upper threshold of its target range.
Conclusion
As investors eagerly anticipate the January Fed meeting, the potential trajectory of the Federal Funds Rate has widespread implications across various sectors of the economy. Understanding the dynamics of this imminent policy decision is paramount for devising informed trading strategies and assessing potential portfolio adjustments. Despite historical trends and prevailing sentiments, the FOMC’s verdict is poised to steer the investment landscape in uncharted territories, warranting vigilance and strategic foresight.
The Impact of Interest Rate Changes on Banking Metrics and the Broader Economy
Net Interest Margin and its correlation with interest rates
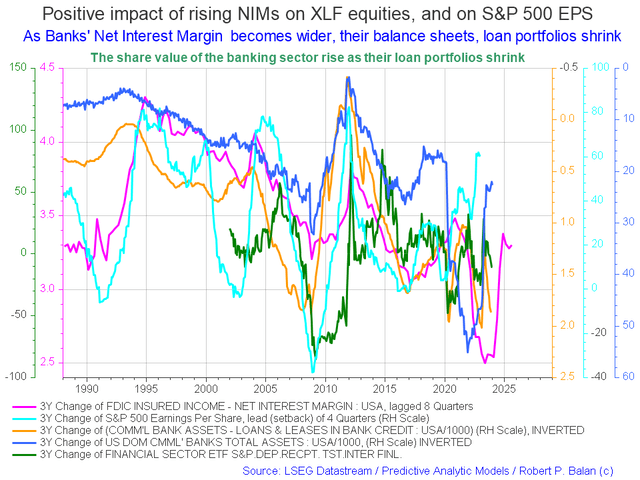
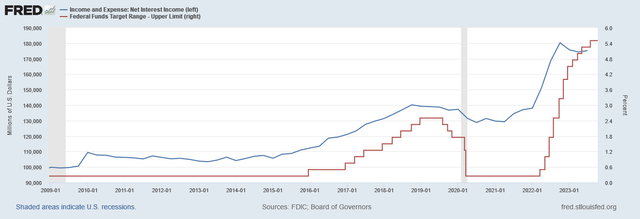
The recent pause in rate rises has halted the growth of Net Interest Margin (NIM) in the banking sector. The NIM, representing the difference between the cost of reserves and lending rates, has risen both in nominal terms and as a percentage.
As rates have surged, the NIM in the USA’s banking sector has increased across the board. However, with the recent hiatus in rate hikes, there has been a cessation in the upward trajectory of the NIM and other associated metrics.
Impact of Interest Rates on Debt and the Economy
The flow of interest from debtors to banks represents an intersectoral transfer of income that doesn’t alter the money supply. However, it does impact the allocation of spending. With rising interest rates, a greater portion of income is diverted from real goods and services, causing a reduction in production demand and contributing to unemployment.
Private debt in the USA stands at 217% of GDP, amounting to over $55 trillion. However, discrepancies arise when comparing this figure with the total bank credit reported by FRED and the Federal Reserve Bank, which amounts to 69% of GDP.
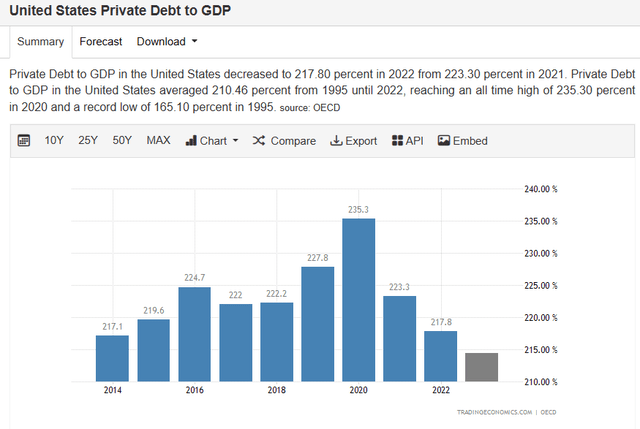
This disparity has led to uncertainty, with stakeholders struggling to reconcile the private debt to GDP calculation. Readers are encouraged to contribute insights in the comments section to address this matter.
Interest Rate Impact on Bank Credit and Income
Despite the absence of substantial growth in aggregate bank credit, interest income for banks has shown a correlated upsurge with the FFR. This rise in interest income occurs even as the stock of loans has remained stagnant, and the aggregate bank credit has even decreased since January the previous year.
This anomaly is mirrored in the fact that over the last two months, bank credit has witnessed a reversal in trend, with over $300 billion in new bank credit creation, despite a decline in loans at a macro level.
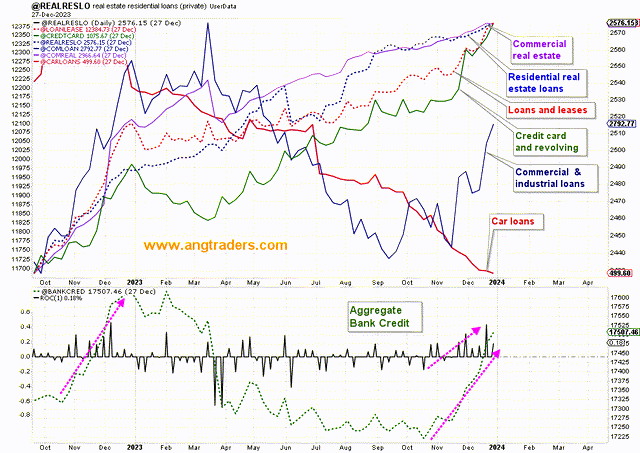
These divergences raise questions about the impact of interest rates on banking behavior and the ultimate effect on the economy at large.
Effects of FFR Changes on the Broader Economy
Every 0.25% change in the Federal Funds Rate (FFR) results in a $139 billion intersectoral income transfer, equivalent to 0.54% of GDP, from the household and business sector to the finance sector. This alteration does not entail the creation of new money, merely a redistribution of funds within the economy.
With the current scenario, just over 11% of GDP is destined for banks as loan interest. However, a projected rise in the FFR to 5.75% could see the intersectoral funds flow escalate to 12.52% of GDP.
While the interest rate on private debt has escalated, the stock of loans has stagnated. This raises concerns about the potential impact of rising interest rates on the broader economy and the efficient allocation of credit.
Impact on Treasury Deposits and Interest on Reserve Balances
An increase in the FFR would result in a flow of $83 billion, either into or out of the economy, with each 0.25% rate change. This relates to interest payments from the federal government to bondholders and entails a net gain of income for the economy.
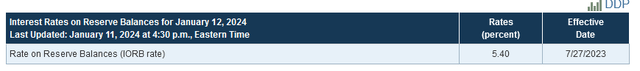
Furthermore, a change in the FFR would impact interest on reserve balances (IORB), which is likely to be set just beneath the FFR. Such a change could contribute approximately $8.16 billion to the economy.
Thus, the impact of FFR changes extends beyond the banking sector, affecting diverse facets of the economy ranging from debt dynamics to the federal government’s interest payments and reserve balances.
A Closer Look at the Impact of Fed Policy Changes on the Financial Sector
The Federal Reserve’s recent policy changes have set the financial sector abuzz, with potential implications for various market participants. As the Fed adjusts its interest on reserve balances (IORB), it has sparked a significant flow of income into the banking sector. This pivotal shift has raised concerns and sparked enthusiasm in equal measure. For investors, understanding the far-reaching consequences of these changes is crucial for making informed decisions.
Shifting Tides in Income Distribution
The Fed’s decision to link interest rate adjustments with the FFR has led to a substantial influx of income into the banking sector. By paying interest to banks on their reserve balances, the Fed has shifted the income dynamics, leading to a marked imbalance in its operational costs and income from these operations. This has had a profound impact on the transfer of funds to the US Treasury, with the Fed accumulating a negative balance on its accounts. While rumors of the Fed going bankrupt have circulated, it’s essential to understand the nuances of central bank dynamics, where the creation of currency is not subject to traditional solvency constraints.
This financial repertoire of the central bank involves the creation and deletion of money through the crediting and debiting of bank accounts in the private sector. It’s akin to an endless source, where the inflow and outflow of money create a consistent stream of income directly into the banking sector. This shift in income distribution has significant implications for various market segments and financial institutions, signaling the need for a comprehensive analysis of its rippling effects.
Unraveling the Financial Impact
The revised IORB has triggered a noteworthy surge in income to the banking sector. With more than $10B flowing into the sector as interest on reserves in December alone, the annual remittance to the banking sector could catapult to approximately $120B. This substantial inflow underscores the transformative nature of these policy changes and their capacity to reshape the financial landscape.
Moreover, the impact extends to repurchase agreements (REPOs), with the banking sector reaping an annual income stream of approximately $37B from this source. While the fluctuating stock of REPOs may result in variations in this income stream, the overarching effect is indisputable, warranting a comprehensive evaluation of the broader financial ramifications.
Implications for Market Participants
The repercussions of the Fed’s policy rate adjustments reverberate across various market actors, presenting both opportunities and challenges. For banks, the augmented income from increased loan interest, treasuries, reserves, and rising net interest margins has the potential to elevate bank stocks. This income boost enables banks to extend their loan book, fostering a cycle of increased fee and interest income.
Conversely, borrowers face the brunt of these rate hikes, grappling with heightened debt service payments that encroach upon their income. This squeeze on household and business borrowers can curtail aggregate demand for goods and services, casting a shadow over the broader economic landscape.
From a macroeconomic perspective, the income fluctuations stemming from rate adjustments hold sway over the overall economy, influencing the money supply and aggregate demand. It’s imperative for investors and market participants to grapple with the intricate interplay of these changes to navigate the evolving financial terrain effectively.
Unveiling the Financial Dynamics
In essence, the Fed’s policy adjustments have ushered in a staggering $79B fiscal expansion, amplifying financial balances in the private sector and bolstering aggregate demand. The surge in interest income from Treasuries underscores the colossal impact of these changes on monetary economics, compelling a reevaluation of traditional economic paradigms.
As market participants navigate this landscape of burgeoning income disparities and financial transformations, a nuanced understanding of the underlying dynamics is indispensable. The confluence of these policy changes and their far-reaching implications necessitates a judicious assessment for investors seeking to chart a prudent course in an evolving financial milieu.
The Unseen Force: How Fiscal Policy Drives Market Moves
Understanding market dynamics is like unraveling a cloak-and-dagger mystery, where the true protagonist is not the flamboyant Fed, but the unassuming fiscal policy. While the Federal Reserve commands widespread attention, it is the movements of fiscal policy that truly steer the markets. These fiscal forces, like clandestine agents, work their way through national and international economies, their impact often subtle yet profound.
The Wild World of Fiscal Flows
Every dollar that enters the US economy triggers a delicate dance. About a third of this currency stays within domestic borders, while the remainder embarks on a global odyssey, finding its way back to the federal government and the hands of foreign owners of treasury bonds. The resulting fiscal flows exert a gravitational pull on market tides, influencing equities, gold, and cryptocurrencies.
Skimming through historical annals, we witness the undulating trajectory of US fiscal liquidity. By multifaceted metrics, this ebb and flow conjures a mesmerizing spectacle, with a forecasted ascent and descent mirroring a rollercoaster ride until 2024. Meanwhile, parallel streams from global powerhouses such as the G5 and China interlace with this narrative, further influencing the markets.
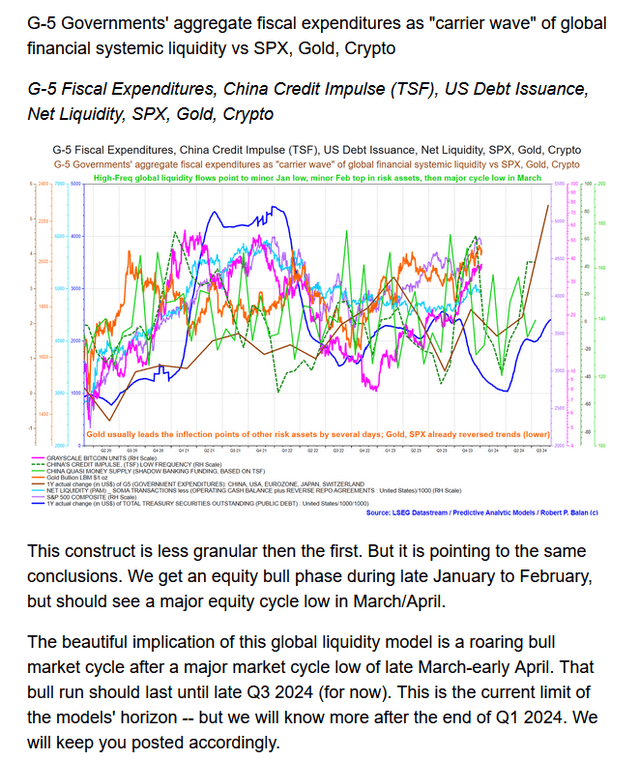
Mapping the Global Fiscal Landscape
Behold the intricate web of fiscal currents stretching across the G5 and China, poised to script the forthcoming market saga. The brown line sketches the sinuous path of the G5 fiscal flows, while the verdant dotted line charts the meandering course of China’s fiscal tides. These fiscal eddies, though subtle, cast a defining shadow on assets like gold, the S&P 500, and cryptocurrencies, their reverberations echoing far beyond the purview of interest rates set by the almighty Fed.