
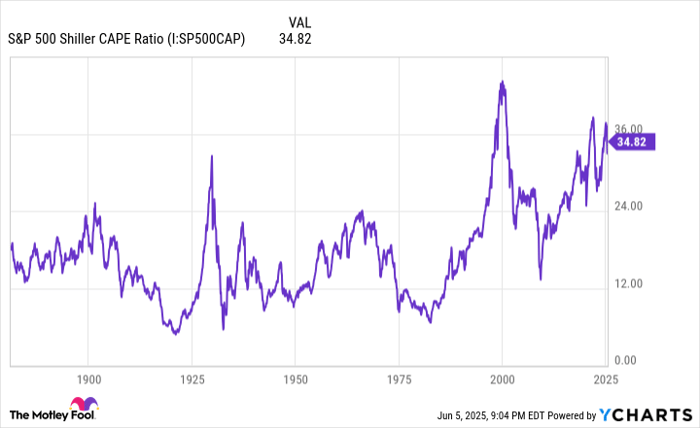
As of June 5, 2025, the S&P 500’s Shiller price-to-earnings (P/E) ratio stands at 36.52, more than double its historical average of 17.24. This high valuation raises concerns about potential market corrections, as historically, instances where the Shiller P/E surpassed 30 have led to subsequent declines of 20% to 89% in major indexes like the Dow Jones and Nasdaq Composite.
Since January 1871, there have only been three occasions where the Shiller P/E neared or exceeded 40, notably before the dot-com bubble burst and the onset of the 2022 bear market. The ongoing fluctuations of the Shiller P/E in recent months suggest similar volatility could be imminent.
Despite recent corrections in the market, historical data indicates that bull markets last significantly longer than bear markets. The average S&P 500 bull market endures for approximately 1,011 days, compared to an average bear market lasting around 286 days, suggesting a favorable long-term perspective for investors.


