TJX Companies Shares Fall Below 200-Day Moving Average
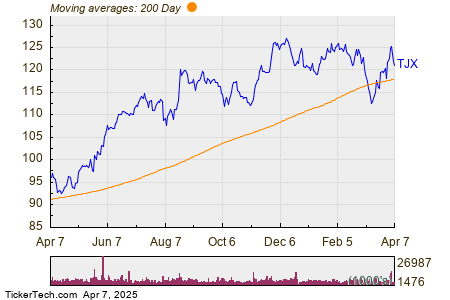
In trading on Monday, shares of TJX Companies (Symbol: TJX) fell below their 200-day moving average, which is $118.20. During the trading session, shares dipped to a low of $116.37, representing a decline of about 3% for the day.
The performance chart presented below illustrates TJX’s stock movement over the past year, compared to its 200-day moving average:

Examining the chart, TJX’s 52-week low stands at $92.35 per share, while its high reached $128.33. As of the latest trade, the stock price was $121.03. The data on the 200-day moving average was sourced from TechnicalAnalysisChannel.com.
![]() Click here to explore which 9 other dividend stocks have recently dipped below their 200-day moving average.
Click here to explore which 9 other dividend stocks have recently dipped below their 200-day moving average.
Also see:
- Top Stocks Held By Larry Robbins
- SHM Shares Outstanding History
- HASI Market Cap History
The views and opinions expressed herein are those of the author and do not necessarily reflect those of Nasdaq, Inc.

