Stay informed with today’s market insights.
Market Rally Influenced by Trump’s Tariff Changes and Tech Stocks
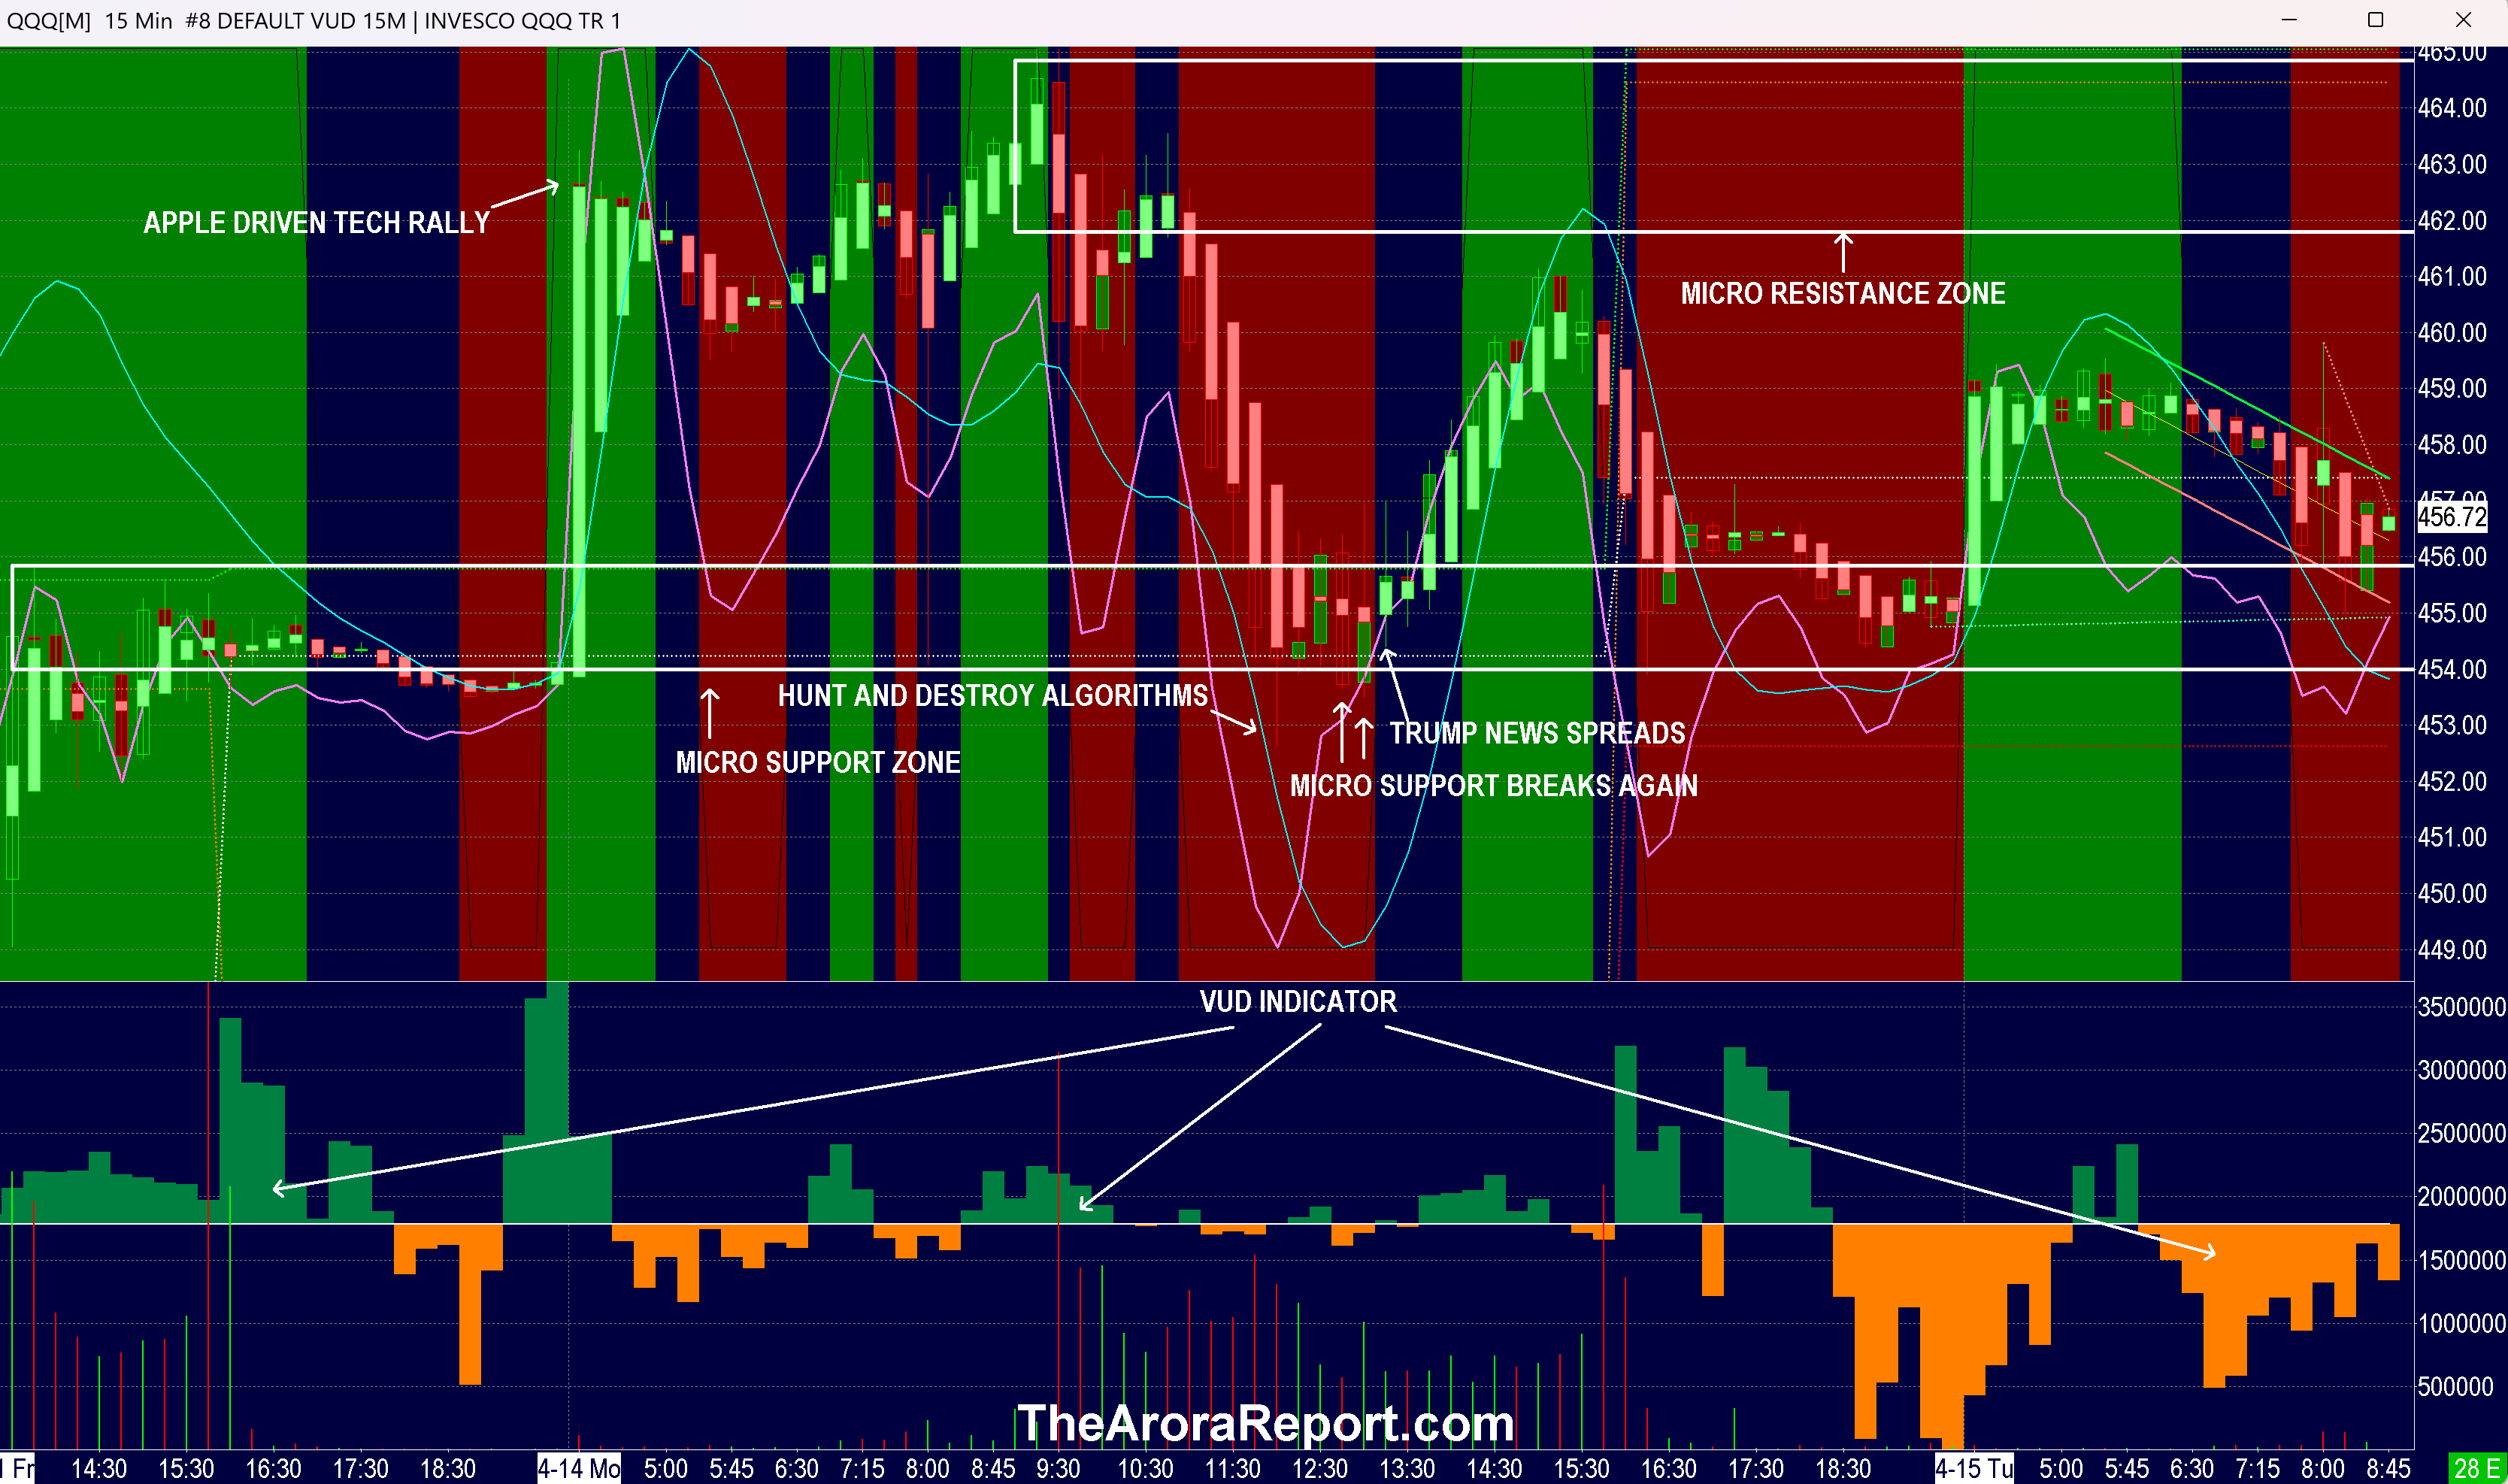
Tech Rally Triggered by Tariff Relief
Please click here for an enlarged chart of Invesco QQQ Trust Series 1 (QQQ).
The following points summarize the recent market activity:
- The recent rally in tech stocks, led by Apple Inc (AAPL), was initiated when President Trump lifted reciprocal tariffs on smartphones, laptops, servers, and certain semiconductors over the weekend. For further details, refer to yesterday’s Morning Capsule.
- Investors had anticipated this change, but many expressed disappointment in the rally’s limited scope.
- The chart indicates that this disappointment led to resistance at a micro level.
- Additionally, when tech stocks struggled to overcome this resistance, selling pressure began to emerge.
- At one point, QQQ fell below the micro support zone, prompting algorithmic trading strategies to target stop-loss orders of investors following traditional technical analysis. This suggests that traders should be cautious with common strategies, akin to leaving valuables unattended.
- Following the triggering of these stop-loss orders, there was a brief rally attempt. Typically, such rallies fail if they fall below established support levels again, which encouraged short sellers.
- News soon circulated that President Trump commented, “I’m looking at something to help car companies with it. They’re switching to parts that were made in Canada, Mexico and other places, and they need a little bit of time, because they’re going to make them here.” This comment was misinterpreted by the market as a signal of potential support for tech stocks as well.
- Ultimately, this rally did not manage to reach the previously established micro resistance level.
- Thus far, the recent pullback has not breached the micro support zone. This indicates an ongoing struggle between bullish and bearish investors:
- A drop below the micro support zone could trigger increased selling pressure.
- A breakout above the micro resistance zone would likely prompt aggressive buying from momentum traders.
- This morning’s release of import and export prices at 8:30 AM ET serves as a cautionary lesson for investors. Numerous economic indicators exist globally, yet import and export prices have not impacted risk-adjusted returns for decades. Hence, this data does not significantly influence our evaluation system. Current tensions from the trade war suggest we might reconsider this indicator later on, especially if it aids in achieving better risk-adjusted returns.
- Despite financial media focusing on this import/export data released this morning, our analysis indicates that it is outdated due to the pre-tariff timing and should be disregarded by investors today.
- In earnings news, Bank of America Corp (BAC) reported better-than-expected results. For transparency, BAC is part of our ZYX Buy Core Model Portfolio, with an entry price of $7.69.
- Investors should avoid the urge to excessively engage in the stock market right now. There are appropriate times to aggressively buy, but the present is fraught with risks. Even if one supports President Trump’s policies, the potential for unforeseen consequences remains. Prudence suggests waiting for a more favorable risk-to-reward ratio before making any significant investments.
Money Flow in the Magnificent Seven
In early trading, positive money flows were noted in Alphabet Inc Class C (GOOG), Meta Platforms Inc (META), and Microsoft Corp (MSFT).
Conversely, NVIDIA Corp (NVDA) experienced neutral cash flow.
Amazon.com, Inc. (AMZN), Tesla Inc (TSLA), and Apple Inc (AAPL) had negative money flows.
Both SPDR S&P 500 ETF Trust (SPY) and Nasdaq 100 ETF (QQQ) displayed mixed money flow.
Tracking Momo Crowd vs. Smart Money
To achieve an advantage, investors should monitor money flows in SPY and QQQ. Additionally, recognizing the buying activity of smarter money across stocks, gold, and oil can provide further insights. Among the most popular ETFs are SPDR Gold Trust (GLD) for gold, iShares Silver Trust (SLV) for silver, and United States Oil ETF (USO) for oil.
Current State of Bitcoin
Bitcoin is experiencing notable buying interest.
Future Market Protection Strategies
Investors should remain focused on future market conditions rather than past performance. Our proprietary protection band integrates data, indicators, current events, and market intricacies…
Investing Strategies: Protecting Assets While Seizing Opportunities
For investors looking for actionable insights, it’s essential to adopt a comprehensive analytical framework. Consider maintaining long-term positions that align with your individual risk preferences. One effective method is to implement a protection band that includes cash, Treasury bills, or short-term tactical trades. This approach allows for downside protection while also participating in potential upside gains.
Your protection bands can be established by combining cash with hedges. For older or more conservative investors, a higher protection band is appropriate, while younger, more aggressive investors might favor a lower protection band. If you choose not to hedge, your total cash level should exceed the previous recommendations but remain lower than the combined total of cash and hedges.
A protection band set at 0% indicates a bullish stance, suggesting full investment without cash reserves, while a band at 100% reflects a bearish outlook that advocates for aggressive protection through increased cash holdings and hedging, or even short selling.
It’s important to remember that a lack of sufficient cash can impede your ability to capitalize on emerging investment opportunities. When adjusting your hedge levels, consider modifying stop quantities for individual stock positions. Implement wider stops on remaining quantities and give high beta stocks more room, as they tend to experience greater fluctuations than the broader market.
Assessing the Traditional 60/40 Portfolio
Current calculations of probability-based risk reward, adjusted for inflation, suggest that a long-duration strategic bond allocation may not be favorable at this time. Investors adhering to the traditional 60% equity and 40% bond allocation should prioritize high-quality bonds with a duration of five years or less. For those willing to adapt their strategies, bond ETFs can be employed tactically instead of as a strategic long-term investment.
The Arora report is recognized for its accurate market predictions. It was among the first to forecast the significant artificial intelligence rally, the new bull market in 2023, and the bear market of 2022. Additionally, it accurately anticipated new stock market highs shortly after the pandemic-induced lows in 2020, the initial market drop of 2020, the DJIA’s rise to 30,000 from 16,000, the beginning of a bull market in 2009, and the financial downturn of 2008. Please click here to sign up for a free, ongoing Generate Wealth Newsletter.