

UBS (NYSE:UBS) is the last remaining behemoth in Swiss banking. It captured attention when it acquired its major competitor, Credit Suisse (CS), for $3 billion, dispelling fears of CS’s impending demise. If you missed the news at the time, several SA articles, including those penned by IP Banking Research, Daniel Jones, and Cavenagh Research, provided invaluable insights.
After witnessing a surge to nearly $30 per share, I’ve pondered on UBS’s further potential. Since the acquisition, the majority of SA analysts have rated UBS a Hold, and my assessment mirrors this sentiment. But what sets this rating apart? My intention is to delve deeply into UBS’s operations, particularly how it stacks up against its peers in value. My focus won’t revolve around the latest quarterly earnings, but on UBS’s future profit potential and its implications for existing shareholders. I will establish a comparative analysis between UBS and its peers to validate why it isn’t valued in line with the most esteemed banks in terms of Price to Book Ratio (P/B), despite a robust Return on Equity (ROE). Subsequently, I will evaluate the earnings potential of each UBS segment and compare it with management’s expectations. The ultimate goal is to outline the necessary conditions for UBS to warrant a reevaluation that will benefit investors. Currently, I believe UBS is a Hold with promising opportunities that merit attention.
Note that all figures are in USD, unless specified otherwise.
Assessing UBS’s Position Among European Banks
UBS is often categorized as just another European bank operating in a region that has experienced sluggish growth since the Great Financial Crisis (GFC) in 2008. To appraise if this label is accurate, a comparison of UBS’s performance against European and American banks based on ROE and P/B seems fitting. In my view, these two metrics are pivotal for appraising a bank. Book Value serves as a precursor for expanding assets (i.e. loans) and its growth is a strong indicator of future earnings. Meanwhile, ROE illuminates how effectively the bank allocates its retained capital (Book Value). Firstly, let’s juxtapose UBS against its European peers in terms of these metrics.
What is evident from the graph below is that before the GFC, European banks held a market valuation of over 1.0 P/B, with the average of the six selected banks likely hovering around 2.0. A P/B above 1.0 denotes a bullish sentiment from the market, signifying an expectation that the bank will continue augmenting its Book Value. Following the GFC, all European banks underwent significant valuation adjustments, resulting in their P/B dropping below 1.0, with sporadic exceptions such as UBS and HSBC (HSBC). A P/B below 1.0 is interpreted as bearish, indicating skepticism from the market regarding the banks’ ability to generate sufficient cash to substantially boost their equity and provide dividends to investors.
UBS’s performance is intriguing: its P/B declined post the Credit Suisse acquisition, yet it has recently reclaimed lost ground. The market was initially slow in acknowledging the acquisition, despite the increase in Book Value, and the stock has now surged to around $30, once again surpassing the 1.0 mark.
A review of the ROE for the same period highlights that the P/B decline among European banks to below 1.0 was justified. Unfortunately, the graph from 2005 to 2023 had to be split in two due to substantial losses during the GFC distorting the ROE for UBS and Deutsche Bank (DB). However, it is evident that between 2005 and 2007, these banks enjoyed ROEs ranging from 15% to 20%, whereas post-2010, their ROE has largely stabilized at 10% or less.
However, UBS emerges as the leader in P/B and ROE. Thus, within the realm of European banks, UBS could be deemed the frontrunner. This raises an intriguing question: if it leads the pack of European banks, how does it measure up against American banks? The subsequent graph illustrates the P/B ratio for UBS and selected American banks. UBS trades on par with Goldman Sachs (GS), surpassing major retail banks such as Bank of America (BAC) and Citi (C), but lags behind the top contenders, JPMorgan (JPM) and Morgan Stanley (MS).
Incorporating the ROE graph clearly indicates that UBS competes favorably with American banks, securing the second position with 11.27%, trailing only behind JPM’s 14.27%. Herein lies the crux: if UBS outstrips Morgan Stanley in ROE, why doesn’t it command a P/B of 1.59, akin to MS? Granted, Morgan Stanley operates differently in the realm of Retail Banking, has made substantial strides since 2010, and has prioritized wealth management more than UBS, but aren’t both entities treading a similar path?
UBS: A Close Examination of Business Segments Performance
The landscape of European banks is fraught with competition, where giants like UBS, JPMorgan (JPM), Morgan Stanley (MS), Bank of America (BAC), Goldman Sachs (GS), and Santander (SAN) vie for market superiority. UBS, renowned for its exceptional standing in the European market, still falls short when compared to the resolute hold that JPM and MS have. To analyze these financial juggernauts effectively, we must delve into the realms of their business segments and dissect the data.
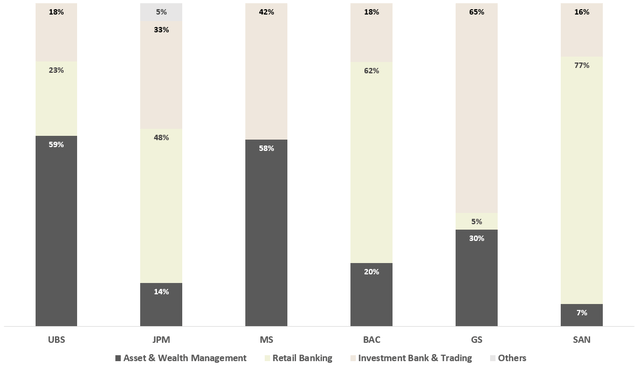
It’s important to note that the revenues of each bank’s segments aren’t standardized in their reporting, thus necessitating a degree of liberty in bundling them for analysis.
Exploring UBS’s Business Segments
Global Wealth Management
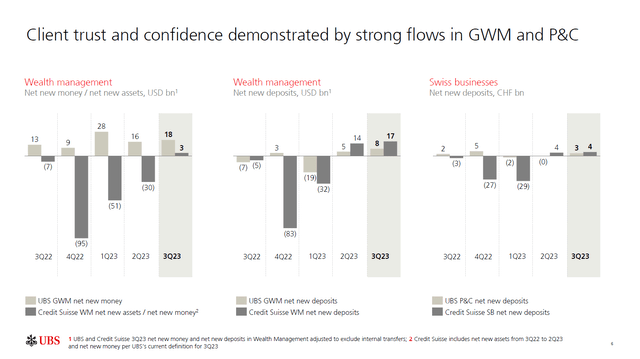
The Global Wealth Management (GWM) segment caters to High-Net-Worth Individuals, Ultra-High-Net-Worth Individuals, and Family Offices. Its range of services includes Portfolio Management, Advisory, Brokerage, and Lending. Notably, it generates revenue primarily from Recurring Net Fee Income (50%), Net Interest Income (33%), and Transaction-Based Income (17%). The stability of GWM’s Recurring Net Fee Income, sourced from monthly fees paid by clients for access to UBS products, renders it a reliable source of revenue. Furthermore, Net Interest Income, earned through lending to clients, and Transaction-Based Income, derived from fees charged for executing transactions, provide additional revenue streams. A pivotal metric in this segment is the growth of Assets Under Management (AUM), a fact substantiated by Q3’23 Earnings slides which affirm UBS’s success in stabilizing the outflow of assets and deposits from Credit Suisse. However, substantial work remains as indicated by the trend in Operating Profit and ROE, which commands heightened focus to restore GWM’s ROE to its customary 25%. The acquisition of Global Wealth Management from Credit Suisse has resulted in a discernible impact on UBS’s ROE, thus warranting strategic efforts to reinstating its 25% baseline. This trajectory is projected to be attained in FY’24 and FY’25, a subject that will be evaluated in the Valuation section.
Personal & Corporate Banking
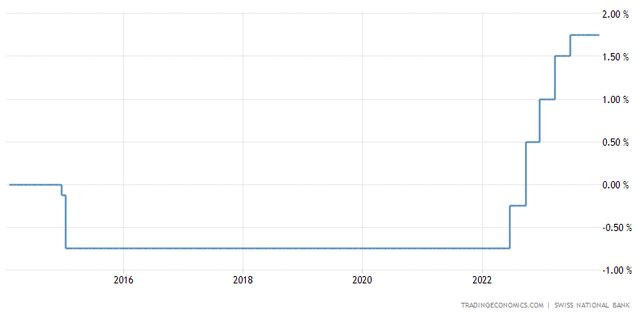
The Personal & Corporate Banking (P&C) segment represents UBS’s retail operations in Switzerland, with 60% of its revenue sourced from Net Interest Income, 18% from Recurring Net Fee Income, and 22% from Transaction-Based Income. Successful stabilization of Credit Suisse’s retail operations and the addition of $7 billion CHF in new deposits during Q3’23 underscore UBS’s progress in this domain. The key indicator for a retail bank remains the country’s interest rate, as exemplified by Switzerland’s transition from a significant period of negative interest rates to a promising positive trajectory. In parallel to the GWM segment, the trend in ROE within the retail banking segment validates the necessity of forecasting a revival commensurate with UBS’s historical ROE until FY’25.
Asset Management
The Asset Management (AM) segment embodies UBS’s in-house products across various asset classes such as Equities, Fixed Income, Hedge Funds, ETFs, and Real Estate. With each segment presenting distinctive challenges and triumphs, a comprehensive analysis of UBS’s business segments lays the groundwork for investors to make informed decisions. It’s crucial to recognize that the performance of each segment plays a pivotal role in influencing UBS’s overall stock performance. By dissecting the various facets of UBS’s business segments, we gain comprehensive insights into the unparalleled complexities of the European banking landscape.
The Future Outlook of UBS
UBS’s Global Wealth Management
In the domain of financial juggernauts, UBS’s Global Wealth Management (GWM) plays a supporting role, representing a modest 6.5% of Q3’23 revenue. It’s not the superhero, but every penny counts. Functioning primarily on management fees, it’s akin to a landlord collecting rent on a small, but not insignificant, property. To visualize, picture GWM as a skilled navigator, steering clients’ funds towards UBS proprietary products or even towards the financial offerings of other institutions.
Investment Banking in the Mix
Investment Banking (IB) sits at the zenith of financial maneuvering, a realm where Credit Suisse was hailed a titanic force pre-crisis. In 2019, the combined IB fees of Credit Suisse and UBS would have catapulted them to the fifth position, outstripping even Citi. However, the luster dimmed with Credit Suisse’s woes, leading to substantial losses in FY’21 and FY’22. The potential for resurrection lies in a rebound of M&A and IPO activity in FY’24. If UBS capitalizes on the residual strength of Credit Suisse in this domain, it could propel operating profit and ROE to new heights.
Valuation and Forecasts
Valuation is a Herculean task, akin to assembling a multifaceted jigsaw puzzle. Summing up the estimated Operating Profit for FY’25 yields $13.8 billion. However, this figure neglects the labyrinthine considerations of taxes, operating profit from the Non-Core and Legacy segments, and corporate expenses. The latter segments have historically posted substantial losses, which spiked to over $2 billion in Q3’23, driven by integration-related expenses. Taking a conservative stance, if we subtract a $1 billion loss for these segments and deduct 25% for taxes, the projection for Net Income in FY’25 stands at $9.6 billion. This translates to a commendable 11.2% ROE, considering the current $85.4 billion Book Value.
Management’s expectations further rattle the crystal ball. Their envisaged ~15% RoCET1 in FY’26 is an intriguing prospect. It signifies a potential uplift but does not align precisely with the forecasted 11.2% ROE. RoCET1 discounts certain capital instruments and risks, and UBS’s Common Equity Tier 1 Capital stands at an impressive $78.6 billion as of Q3’23. Simultaneously, a conservative scenario projects an 11% ROE, in line with historical data, while a more aggressive 14% ROE closer aligns with management expectations and the assimilation of Credit Suisse.
The ultimate enigma lies in the correlation between ROE and Book Value growth. It’s not just numeric hocus-pocus; rather, it symbolizes a bank’s essence and vigor. Essentially, the growth in Book Value can influence ROE, leading to a myriad of potential outcomes. Should the Bank achieve greater ROE and Book Value growth, it would be akin to music to investors’ ears, an orchestral crescendo in the financial symphony.
UBS – Between a Rock and a Hard Place: A Financial Analysis
When a company like UBS is caught between a rock and a hard place, there’s an internal struggle between maintaining a solid but unexciting position and venturing into the unknown in the hope of brighter prospects. This metaphor aptly sums up UBS’s current situation as it seeks to chart a course between stability and growth. The question lingering in investors’ minds is whether to Hold, Buy or Sell UBS stock. Let’s delve into the financial undercurrents and try to make sense of this quandary.
Historical Context: UBS’s Financial Trajectory
UBS has a storied financial history, with its Book Value per Share experiencing minimal growth in the past two decades, except for a noteworthy spike following the acquisition of Credit Suisse. That move saw the stock climb from $20 to $30, reminiscent of low-hanging fruit that has already been picked. However, this surge seems to have left little upside in its wake.
Market Dynamics: The Convergence of ROE and Book Value
The convergence of Return on Equity (ROE) and Book Value per Share growth becomes the linchpin for UBS’s future valuation. If the company succeeds in bolstering its ROE and augments its Book Value, shareholders can expect a favorable rerating, potentially translating to a stock price surge from $30 to $45. Conversely, an ROE uptick without a concurrent Book Value increase may peg UBS as akin to a bond offering a 10% annual return, with muted price appreciation prospects.
Risks and Q4 Earnings Expectation
The integration of Credit Suisse poses a significant risk to UBS’s trajectory. Although the gesture of relinquishing its loss protection agreement with the Swiss government is a positive political move, the impact of potential losses emanating from the discontinued operations of Credit Suisse looms large. Furthermore, the economic terrain and the impending Q4’23 earnings announcement need careful monitoring, with the aim of discerning signs of improving ROE and Book Value. The murky numbers from this integration should not be seen as adverse news, but rather as a cloud with a silver lining.
Takeaway: Investment Insight
In this climate of uncertainty, a “Hold” rating prevails as the wiser course for UBS investors, particularly for those who embarked on their journey with UBS at the time of the Credit Suisse acquisition announcement. The dichotomy of a 10% bond-like stock versus a stock that is potentially on the cusp of a P/B rerating and a 50% upside calls for measured action. Conclusive signals in Q4’23 or subsequent quarters might sway the recommendation to Buy, but prudence is warranted at the moment.


